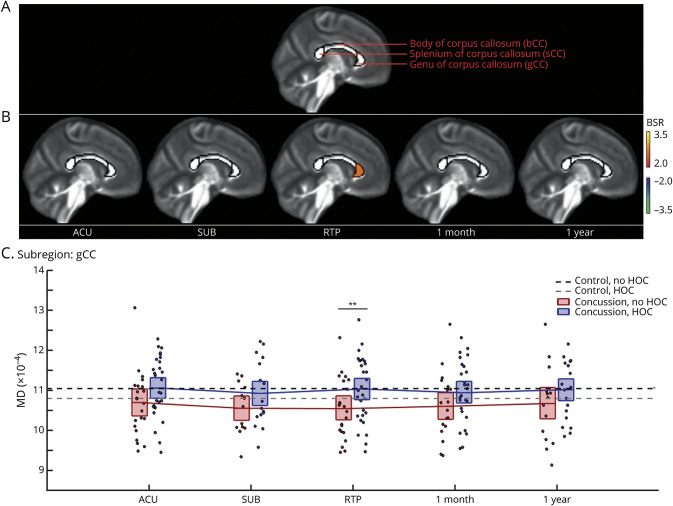
Figure 3. Effects of HOC on post-concussion mean diffusivity (MD).
(A) Segmentation of the corpus callosum based on the John Hopkins University atlas into 3 subregions. (B) For callosal regions and imaging sessions showing significant history of concussion (HOC) effects on mean diffusivity (MD) during concussion recovery, standardized effects are shown as bootstrap ratios (BSRs). (C) Distribution of concussed athlete MD values for the subregion showing effects at return to play (RTP), as denoted by double asterisks. For distribution plots, concussed athletes without and with HOC are plotted separately. Horizontal red/blue lines denote group means, and boxes indicate 95% confidence intervals. Distribution means are connected between sessions by solid red/blue lines, and the mean MD values for controls without and with HOC are plotted as black and gray horizontal dashed lines, respectively. ACU = acute phase of injury; SUB = subacute injury.

