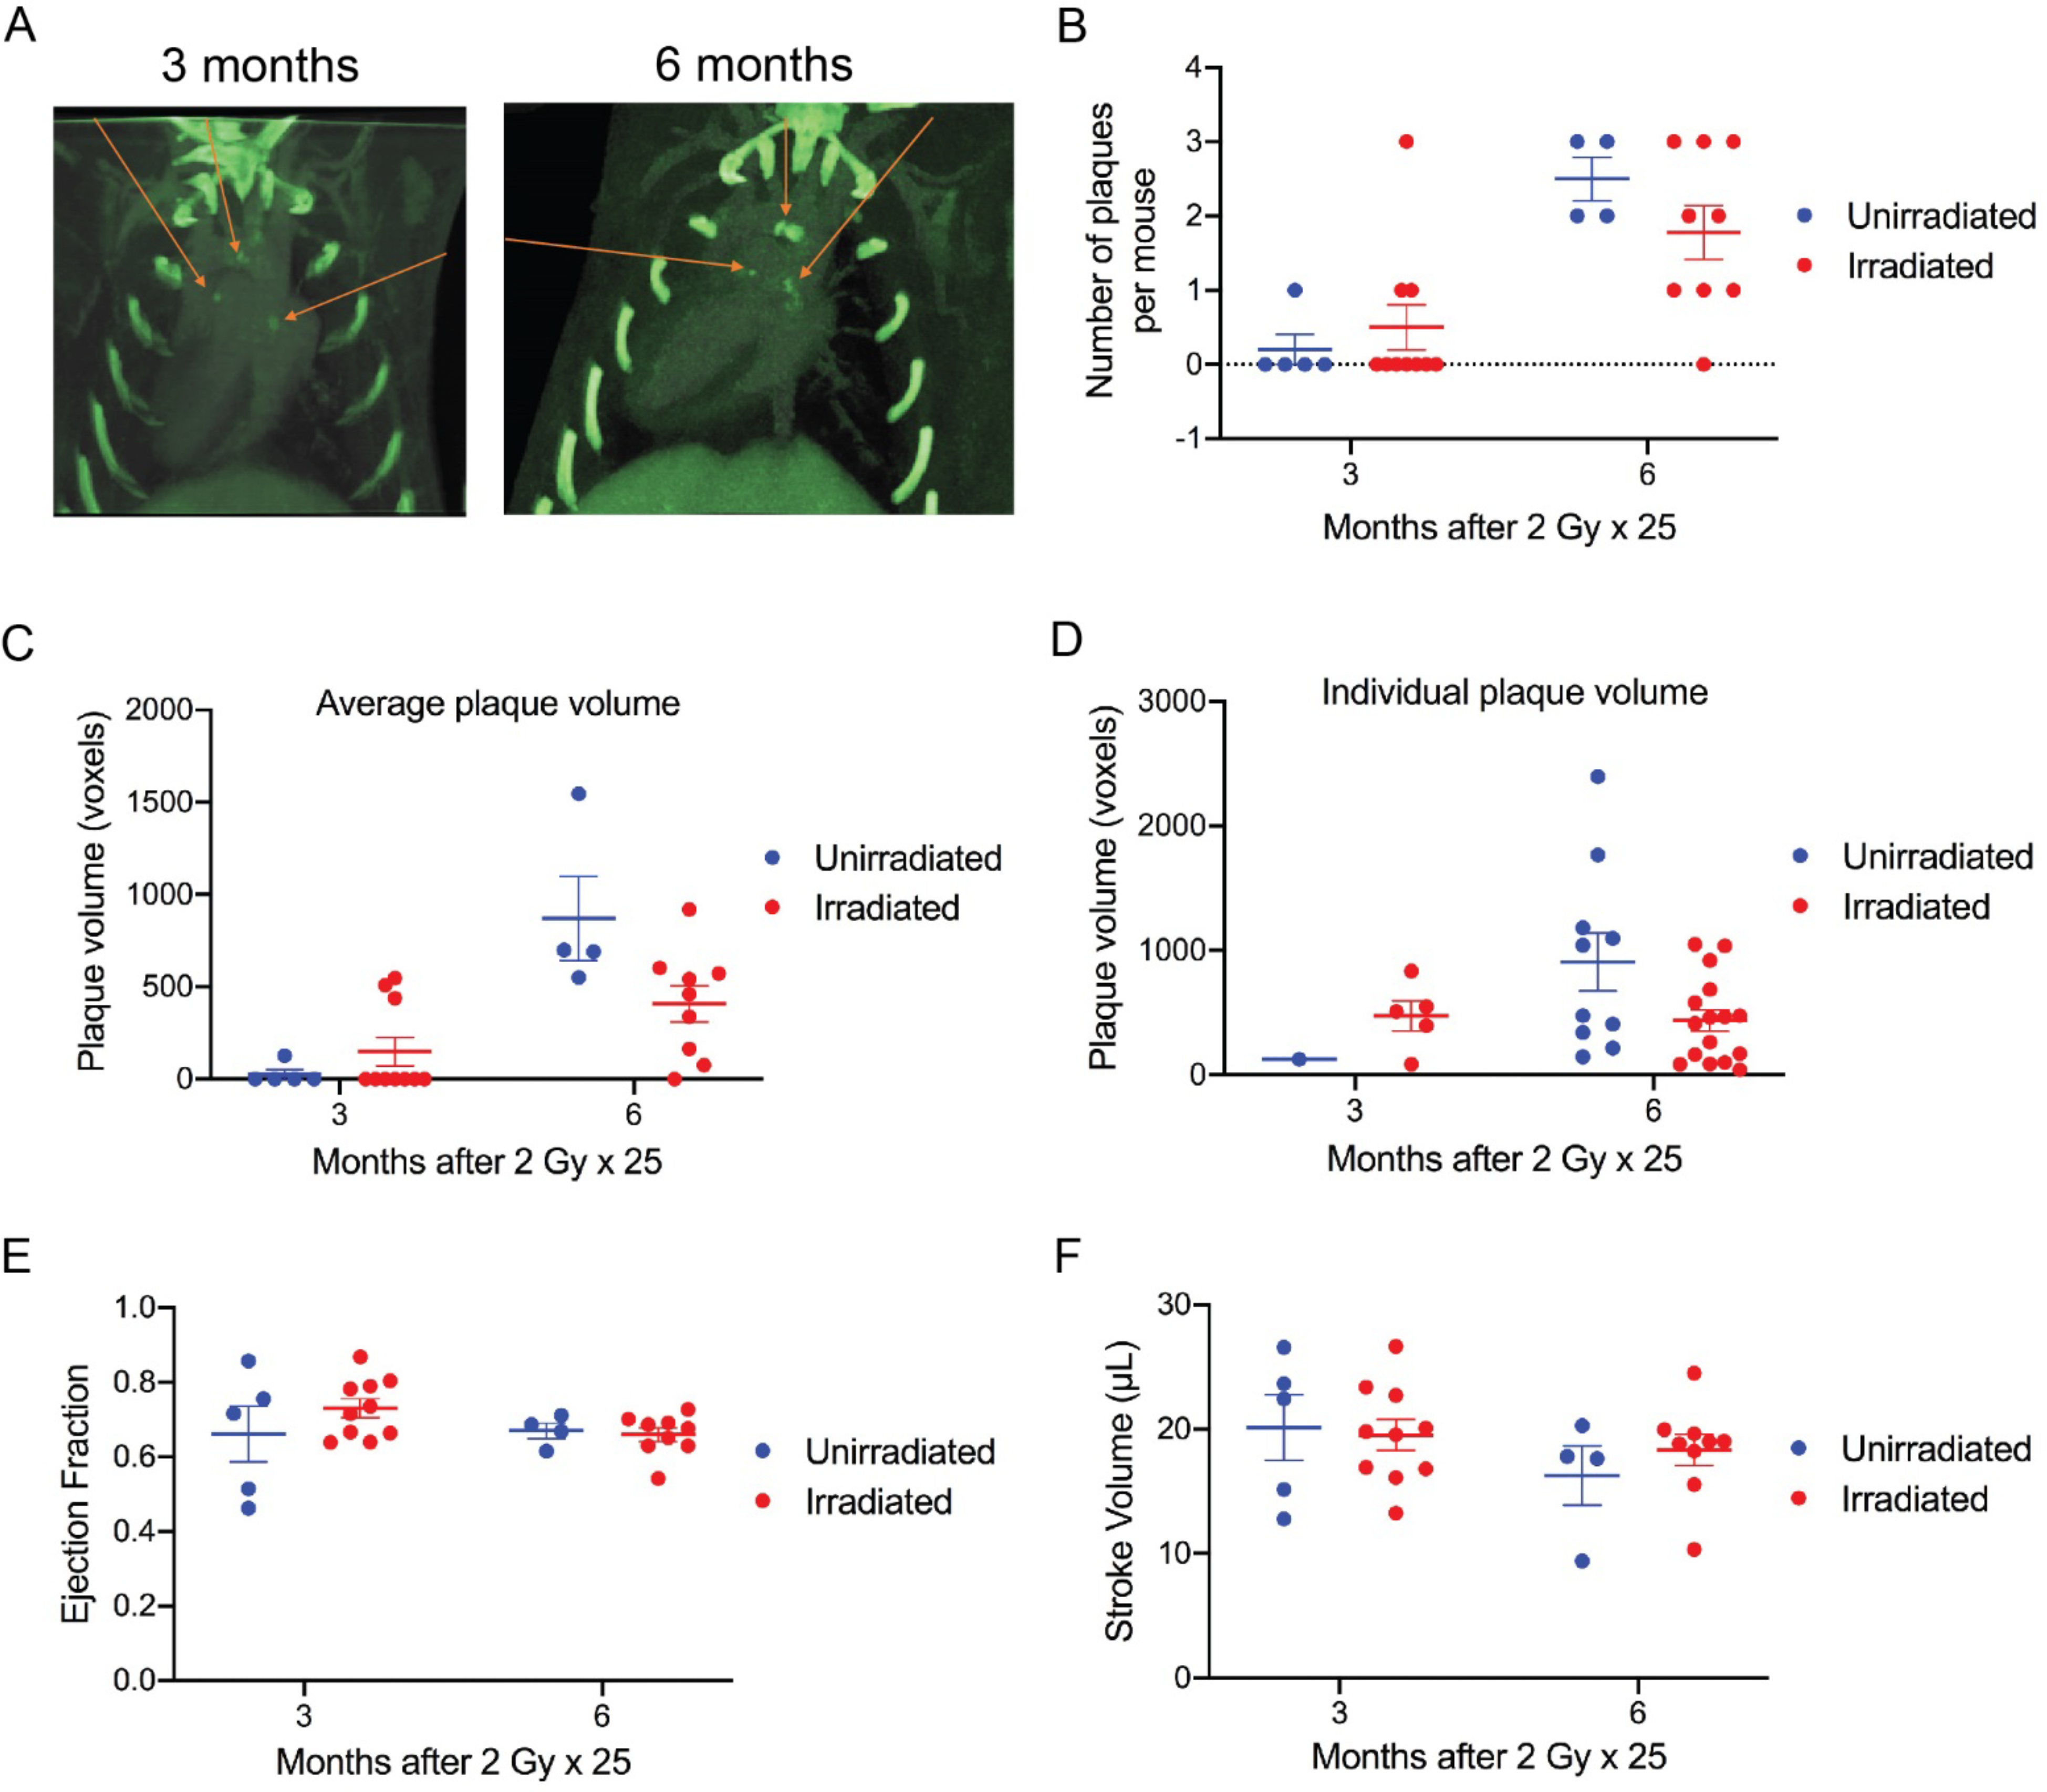
Figure 3.

Assessment of calcified plaques and cardiac function of irradiated and unirradiated ApoE−/− mice using dual-energy CT. (A) Representative images of calcified plaques detected by dual-energy CT. Images were obtained from the same mouse 3 and 6 months after 2 Gy × 25 partial-heart irradiation, respectively. Red arrow indicates individual plaques. (B and C) Dot plot showing the total number of calcified plaques and the average volume of plaques per mouse in unirradiated and irradiated mice 3 and 6 months after irradiation. Each dot represents one mouse. (D) Dot plot showing the volume of individual plaques per mouse in unirradiated and irradiated mice 3 and 6 months after irradiation. Each dot represents one plaque. (E and F) Assessment of ejection fraction and stroke volume by CT in unirradiated and irradiated mice 3 and 6 months after irradiation. Each dot represents one mouse. Data are presented as mean ± SEM. N=5 and 10 for unirradiated and irradiated mice, respectively, at 3 months; N=4 and 9 for unirradiated and irradiated mice, respectively, at 6 months. One unirradiated mouse was found dead after the 3-month scan and high-quality scan for one irradiated mouse at 6 months was not successfully acquired.
