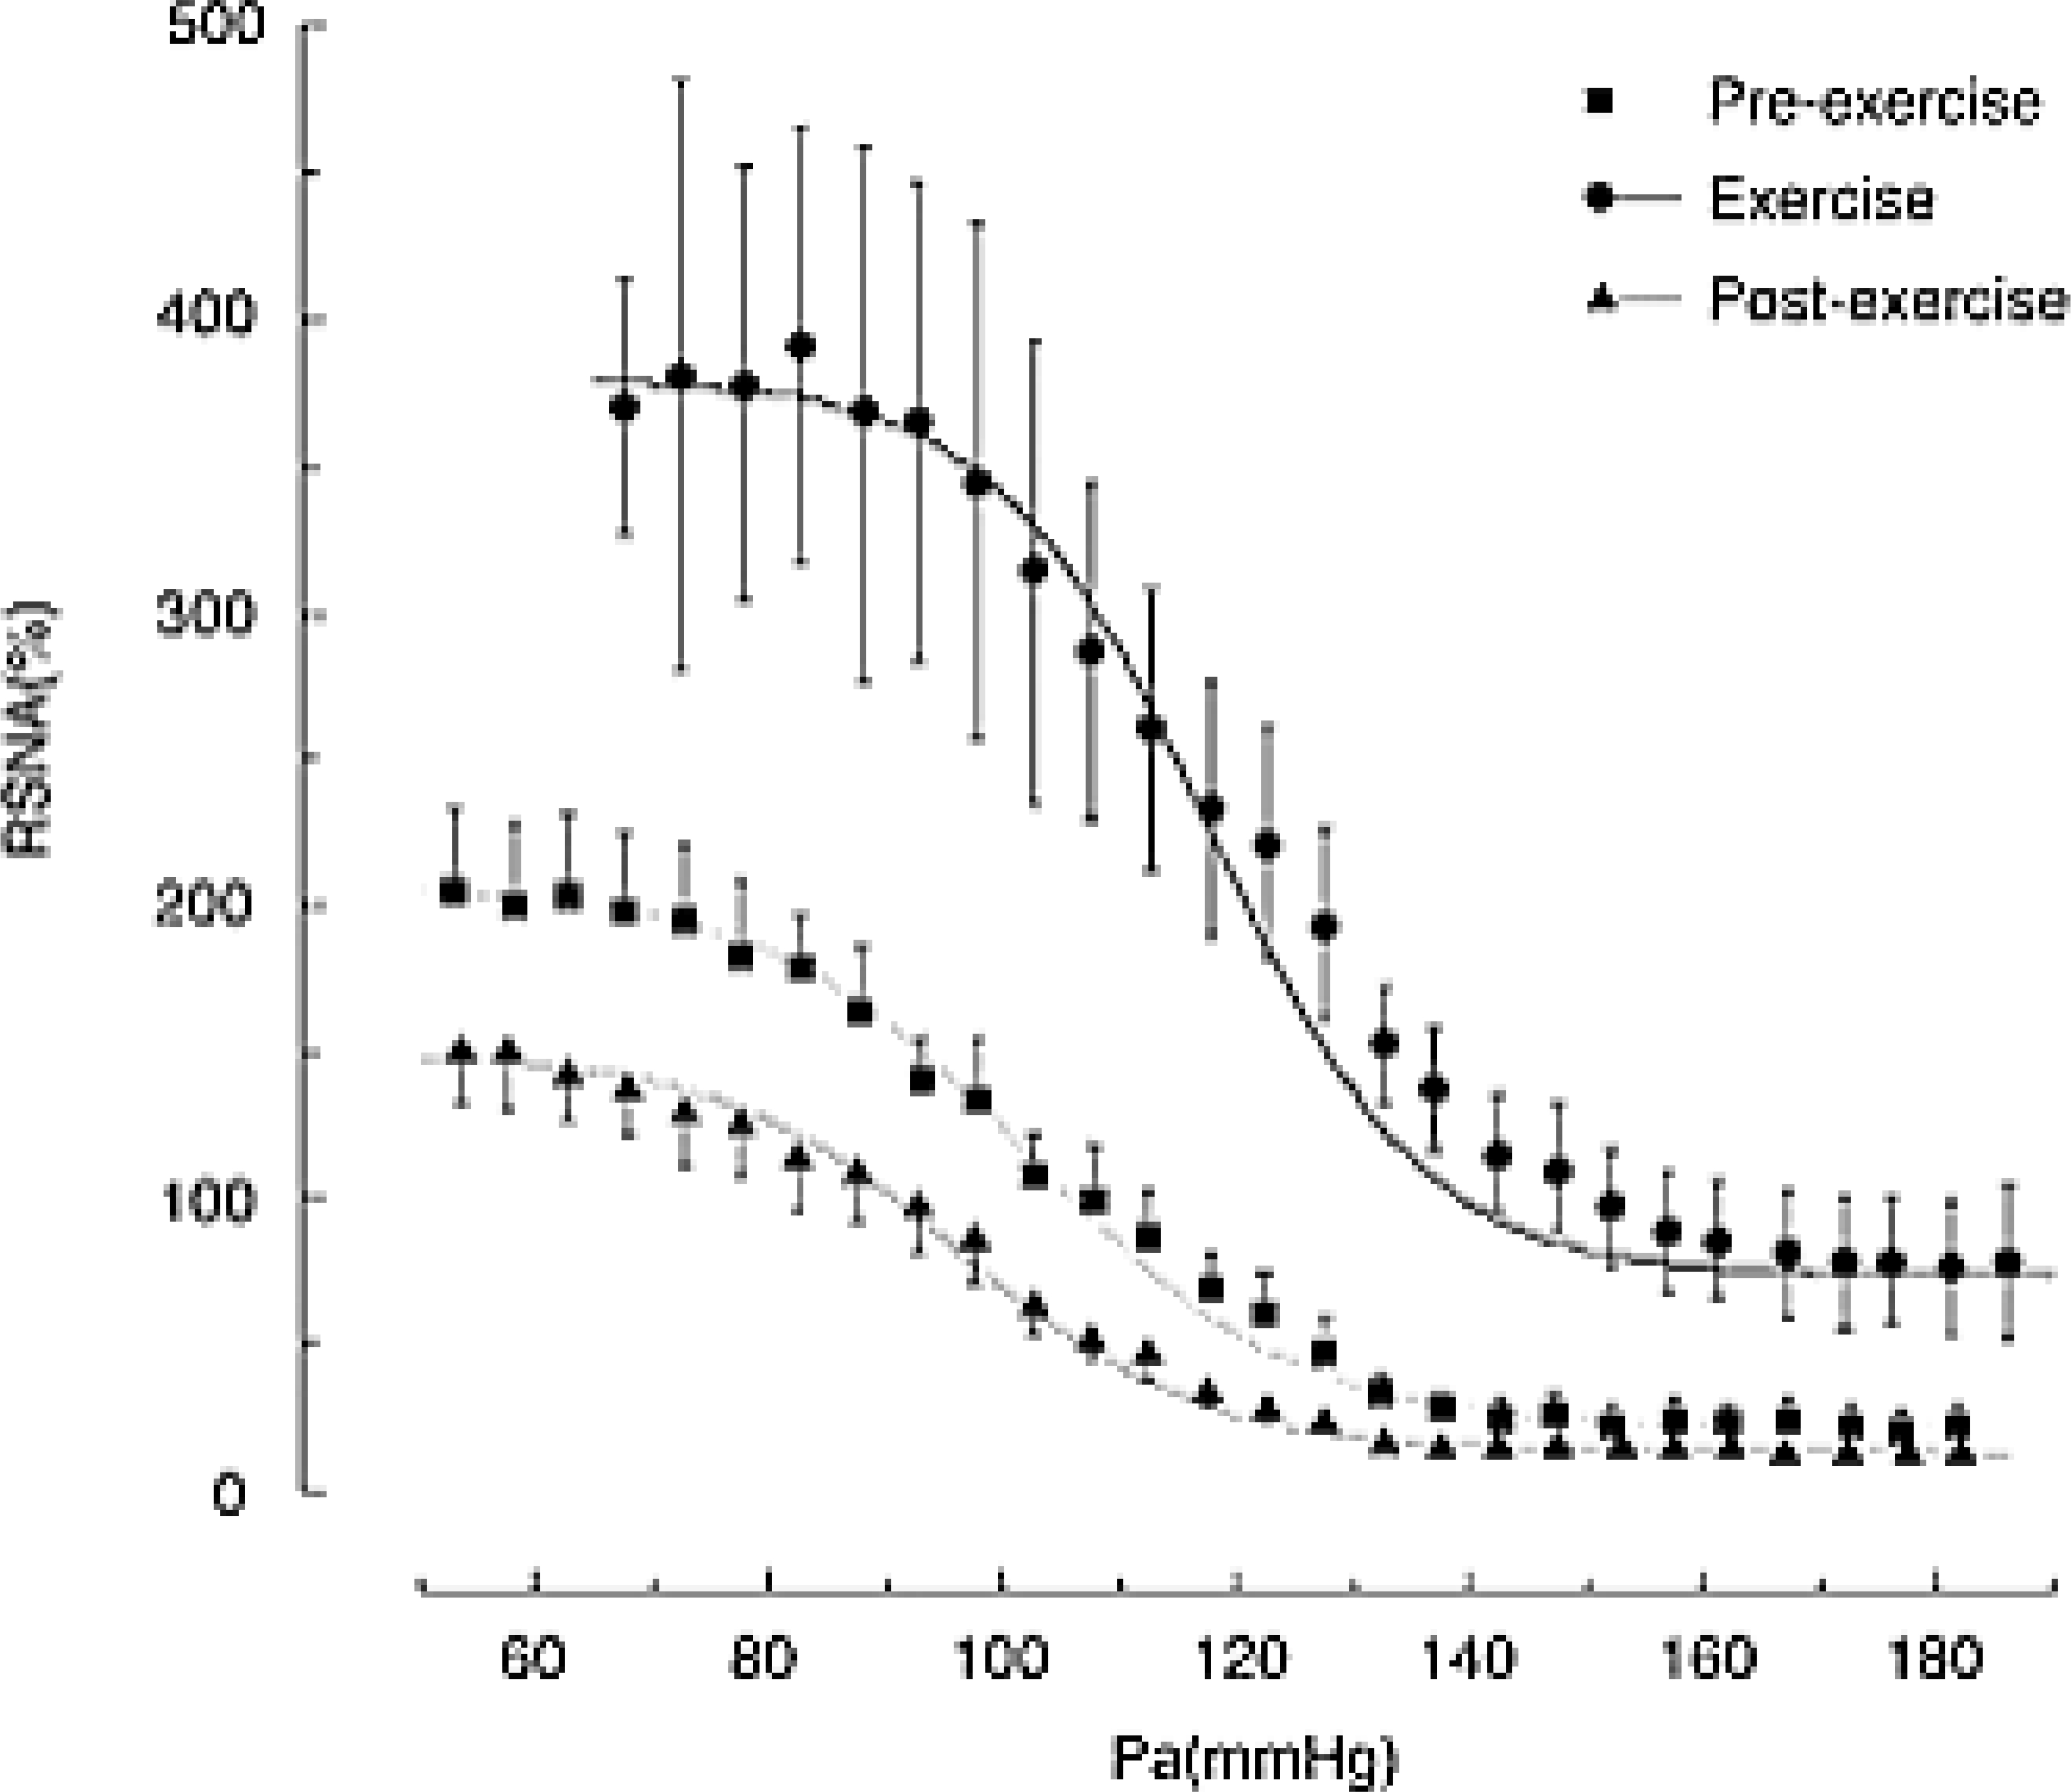
FIGURE 5.

Shifts in the baroreflex curve for renal sympathetic nerve activity (RSNA) obtained during pre-exercise (resting), treadmill exercise, and the post-exercise periods. Curves reflect data averaged from 11 animals, whereas symbols and bars indicate means ± s.e.m., respectively, estimated over each 2.5 mmHg bin of arterial pressure (Pa). Unlike the baroreflex controlling heart rate and mean blood, notice an increase in the slope of the curve during the exercise, which indicates a higher gain of the baroreflex. Reproduced with permission (356).
