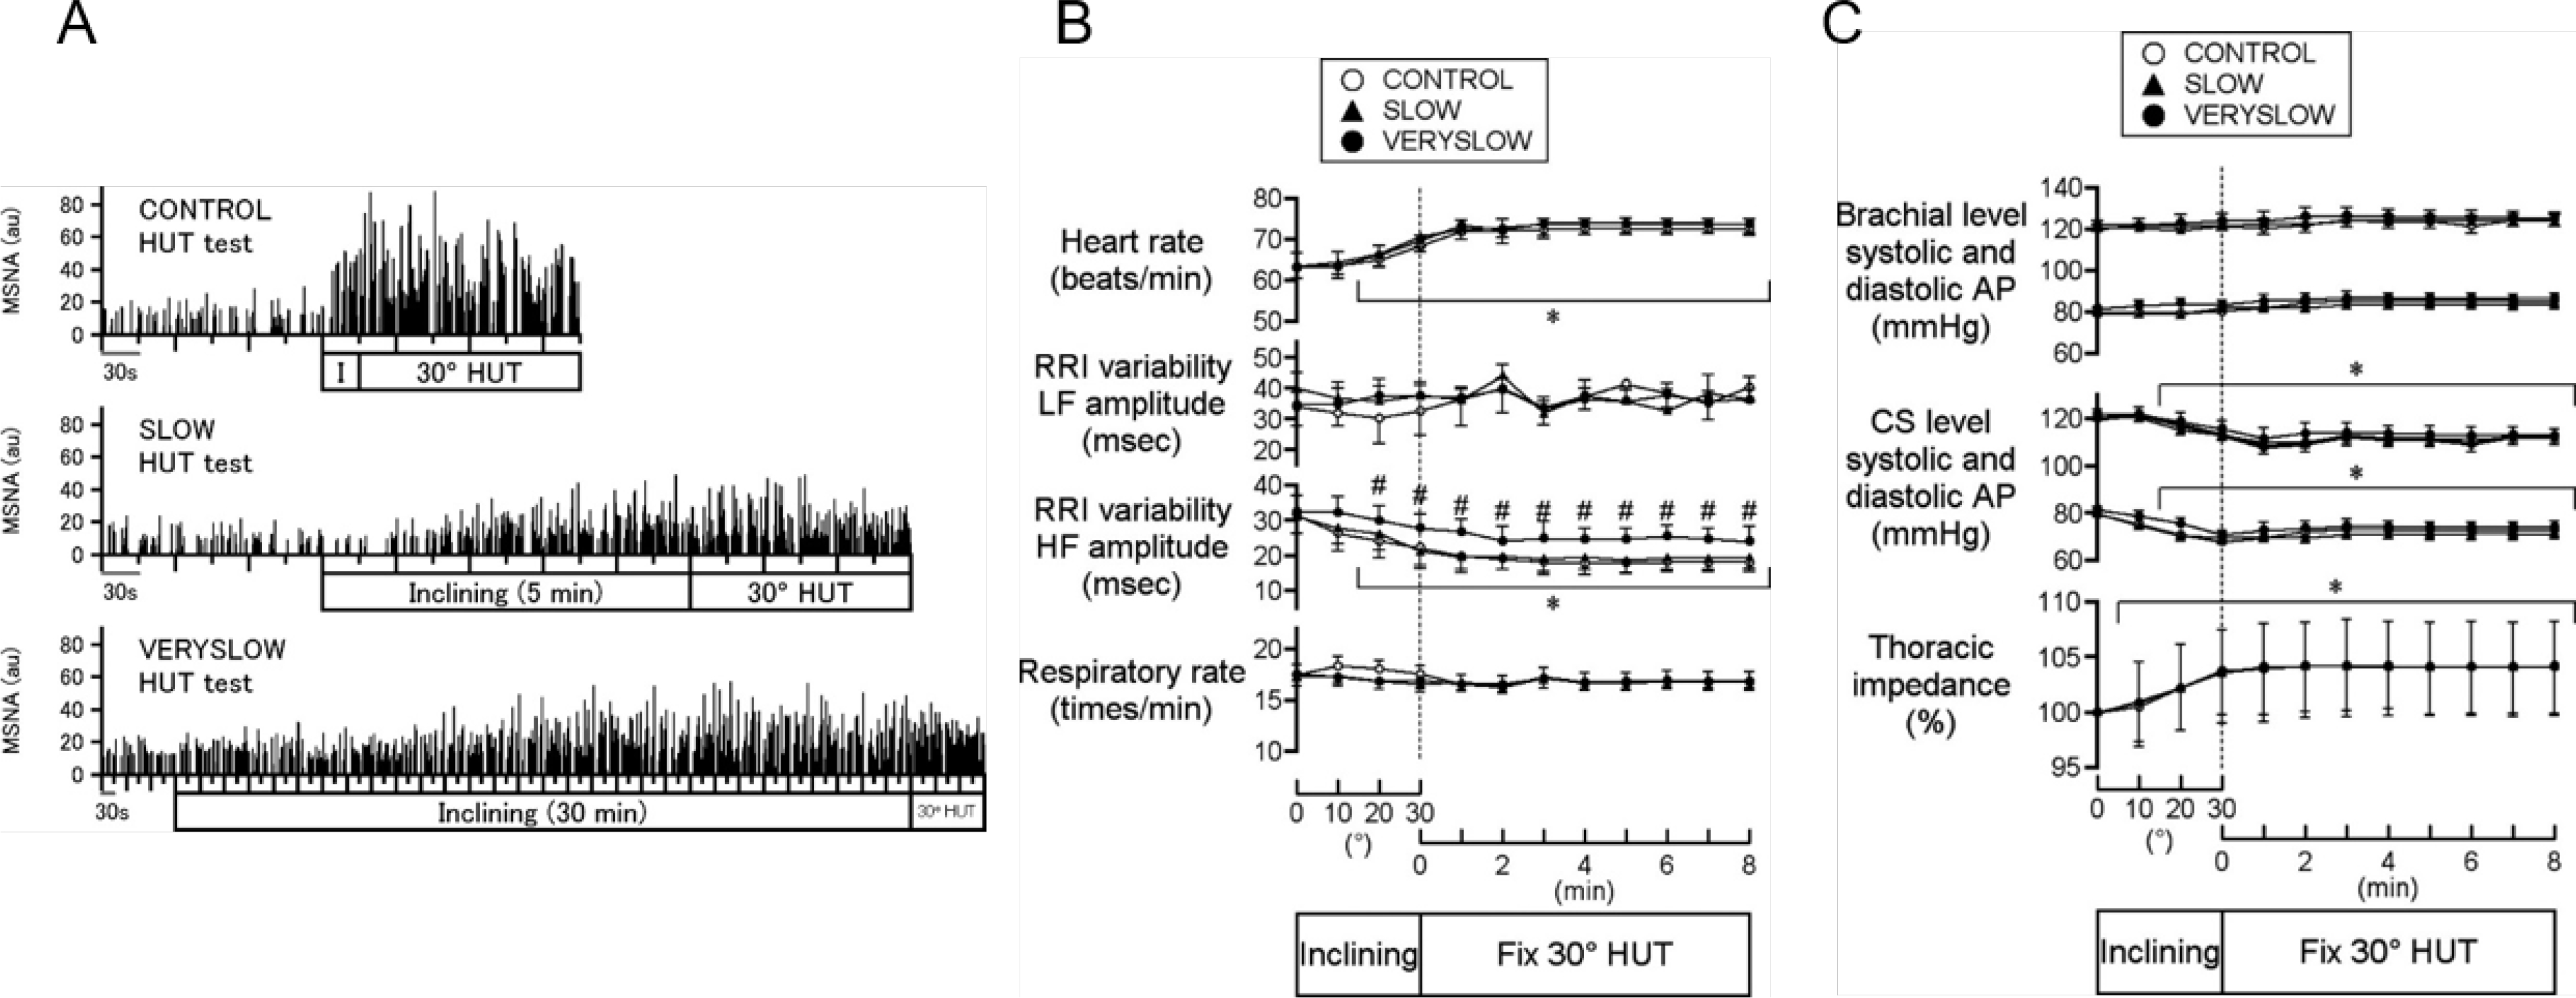
FIGURE 6:

A. Representative muscle sympathetic nerve activity (MSNA; integrated signals) data during control (top), slow (middle), and very slow (bottom) head-up tilt (HUT) tests in a human subject. I (top), a period of inclination of the tilt bed from 0° supine to 30° HUT posture at an inclining speed of 1°/s. Inclining (middle and bottom), a period of inclination of the tilt bed at speeds of 0.1 and 0.0167°/s, respectively. au, Arbitrary units. B. Heart rate, the amplitude of low frequency (LF) and high frequency (HF) component of R-R interval (RRI) variability, and respiratory rate during control (○), slow (▴), and very slow (•) HUT tests. The x-axis to the left of the vertical dotted line indicates that data are averaged over every 10° tilt angle during inclination from 0° supine to 30° HUT, and the x-axis to the right of the dotted line indicates that data are averaged over every 1 min after reaching 30° HUT. #P < 0.05 vs. control and slow tests; *P < 0.05 vs. 0° supine posture. C. Systolic and diastolic arterial pressure (AP) measured at the height of brachial level and predicted at the height of carotid sinus (CS) level, and thoracic impedance (percentage of baseline value at 0° supine) during control (○), slow (▴), and very slow (•) HUT tests. The x-axis to the left of the vertical dotted line indicates that data are averaged over every 10° tilt angle during inclination from 0° supine to 30° HUT, and the x-axis to the right of the dotted line indicates that data are averaged over every 1 min after reaching 30° HUT. *P < 0.05 vs. 0° supine posture. Error bars denote SE. Modified and reproduced with permission (255).
