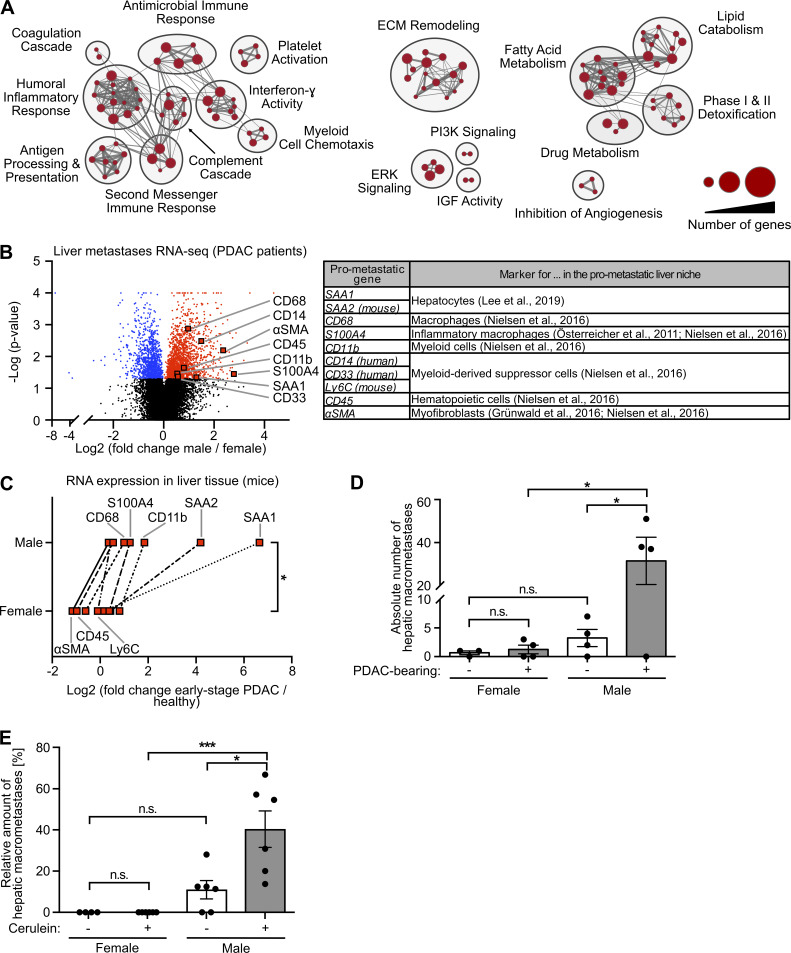
Figure 2.
Metastasis-promoting conditioning of PDAC-primed livers occurs in a male-biased manner. (A) GSEA revealed male-specific up-regulation of fibrosis-, immune-, and lipid metabolism–related processes in the liver of PDAC patients. Genes with significant differential expression in the liver tissue of female (n = 9) and male (n = 14) PDAC patients (see Table S1) were employed as a gene list, whereas male versus female fold change in gene expression was used as the gene rank in GSEA. Biological processes (“nodes”) were significantly up-regulated in male livers (NES ≥2.0, FDR q-value ≤0.01), whereas no biological process was detected as down-regulated in male livers (NES ≤2.0, FDR q-value ≤0.01). The size of connections (“edges”) correlates with overlapping genes between the respective nodes. ECM, extracellular matrix; IGF, insulin-like growth factor; PI3K, phosphoinositide 3-kinase. (B) Volcano plot of transcriptomic data showing sex-dependent expression of metastasis-promoting genes (right) in liver metastases of female (n = 9) versus male (n = 14) PDAC patients. Student’s t test was employed to calculate P values. Genes were considered to be significantly up-regulated (red) or down-regulated (blue) in males after Benjamini-Hochberg adjustment (see also Table S1). αSMA, α-smooth muscle actin. (C) The median fold change in hepatic mRNA expression of metastasis-promoting genes of KPC mice with early-stage PDAC (female: n = 3; male: n = 5) normalized to healthy control mice (female: n = 4; male: n = 4). The Wilcoxon signed-rank test was employed for statistics. (D) Quantification of hepatic macrometastases after challenge of control (female: n = 3; male: n = 4) or KPC mice (female: n = 4; male: n = 4) by i.v. inoculation of tumor cells. Data were derived from two independent experiments. Student’s t test and the Mann-Whitney test for independent variables, respectively, were employed for statistics, depending on normal distribution. Data are presented as mean ± SEM. (E) Quantification of the proportion of macrometastases in relation to total hepatic metastases (macro- plus micrometastases) after challenge of control (female: n = 5; male: n = 6) or cerulein-treated mice (female: n = 6; male: n = 6) by i.v. inoculation of tumor cells. Data were derived from three independent experiments. Student’s t test was employed for statistics. Data are presented as mean ± SEM; *, P ≤ 0.05; ***, P ≤ 0.001 (C–E).

