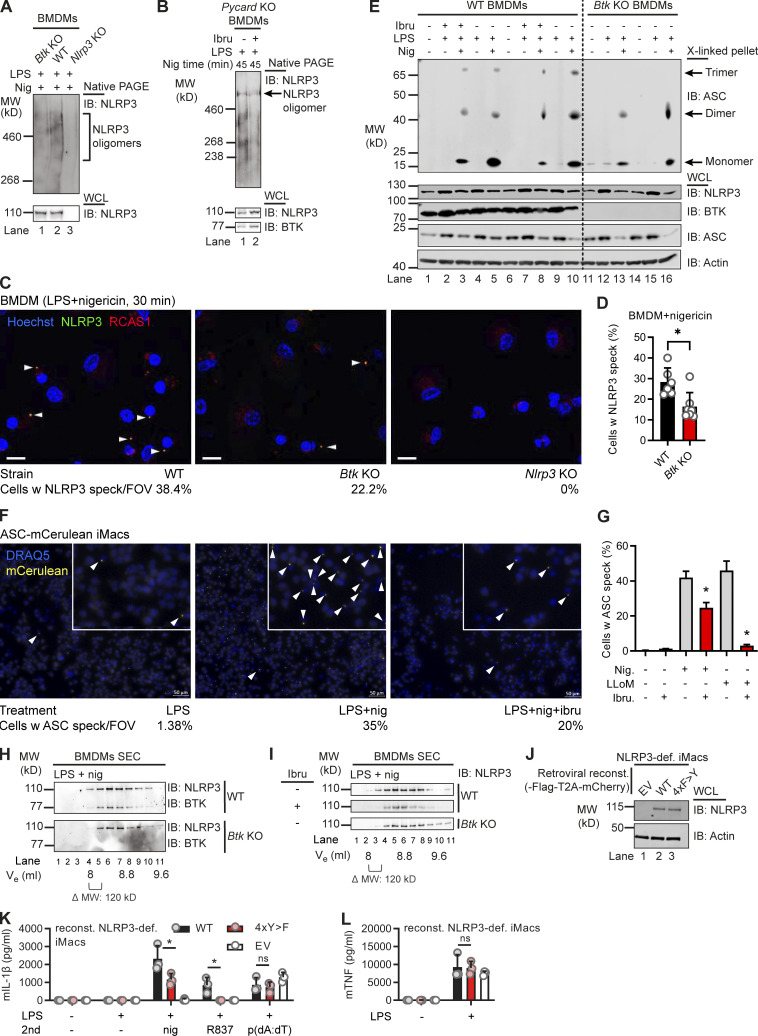
Figure 4.
BTK modification affects NLRP3 oligomerization and IL-1β release. (A and B) WT, Btk KO, Nlrp3 KO, or Pycard (ASC) KO BMDMs stimulated (45 min nigericin) and respective lysates analyzed directly by native PAGE (A, n = 2; B, n = 4). (C) Representative fluorescence microscopy images of NLRP3 specks in WT, Btk KO, and Nlrp3 KO primed with LPS, stimulated (30 min nigericin), and stained as indicated (n = 2). Blue, nuclei (Hoechst); green, NLRP3; red, Golgi (RCAS1). Scale bar = 10 μm; arrowheads mark NLRP3 specks. (D) Quantification from multiple 3 × 3 tiles per strain per experiment. (E) As in A or B but ASC in WCLs was cross-linked upon stimulation, with or without ibrutinib pretreatment (n = 4). (F) Representative fluorescence microscopy images of ASC specks in Nlrp3 KO iMacs reconstituted with NLRP3-Flag ASC-mCerulean and stimulated as indicated. Blue, nuclei (DRAQ5); yellow, ASC (mCerulean). Scale bar = 50 μm; arrowheads mark only one ASC speck per overview image for the sake of clarity, but in the insets, all specks are marked. (G) Quantification from multiple images per treatment per experiment (n = 2). (H) As in A but lysates were applied to size-exclusion chromatography (SEC) before fractions were analyzed (n = 3). (I) As in H comparing inhibitor-treated WT BMDM or Btk KO BMDM lysates (n = 3). (J–L) NLRP3 expression levels determined by immunoblot (IB), IL-1β, or TNF release quantified by triplicate ELISA in/from WT or 4xY>F NLRP3-reconstituted NLRP3-deficient iMacs (n = 3). D, G, K, and L represent combined data (mean + SD) from n technical replicates. A–C, E, F, H, and I are representative of n biological (mice) or technical replicates. *, P < 0.05 according to Mann–Whitney U test (D), Student’s t test (G), and one-way ANOVA with (K) or without (L) Šidák correction. def., deficient; EV, empty vector; FOV, field of view; Ibru, ibrutinib; Nig, nigericin; reconst., reconstituted; Ve, elution volume; w, with.

