Figure S2.
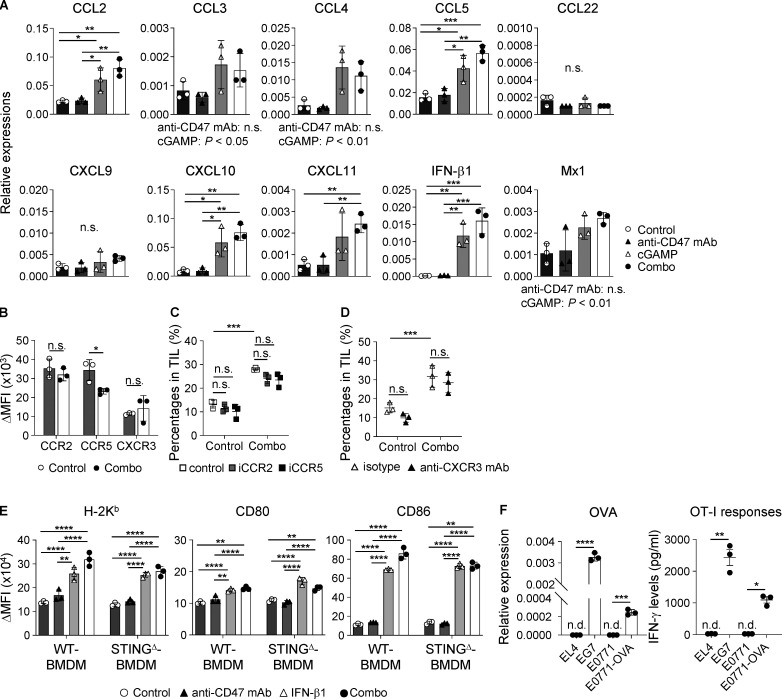
Enhanced inflammatory responses by cGAMP-triggered type I IFNs. (A) Gene expression levels in tumor tissues at 2 h after intratumoral treatment with anti-CD47 mAb and/or cGAMP (n = 3; data are representative of two independent experiments). (B–D) Monocytes/macrophages in TILs of WT mice were assessed at 24 h after intratumoral treatment with control and combination therapy with regard to expression levels of chemokine receptors (B) and for their percentages in the presence of inhibitors for CCR2 (iCCR2; 100 µg) or CCR5 (iCCR5; 100 µg; C) and blocking antibody for CXCR3 (anti-CXCR3 mAb; 100 µg; D), which were i.p. administered to mice 2 h before intratumoral treatment. Vehicle alone and isotype antibody were used as controls for the inhibitors and antagonistic antibody, respectively (n = 3; data are representative of two independent experiments). (E) Expression levels of H-2Kb, CD80, and CD86 on WT- and STINGΔ-derived BMDM cocultured with E0771 in the presence of anti-CD47 mAb (10 µg/ml) and/or rIFN-β1 (2,000 U/ml) for 24 h (n = 3; data are representative of two independent experiments). (F) The OVA-encoding gene-transfected E0771 cell line (E0771-OVA) was established and validated by determining Oval gene expression (left panel) and OT-I T cell responses (right panel) using real-time PCR and ELISA, respectively. Mouse EL4 and EG7 cell lines were used as negative and positive controls, respectively (n = 3; data are representative of two independent experiments). n.d., not detected. Change in (Δ)MFI against isotype control was calculated (target MFI minus control; B and E). Data are shown as mean ± SD (A–D) or SE (E and F). *, P < 0.05; **, P < 0.01; ***, P < 0.001; ****, P < 0.0001; two-way (A, D, and E) and one-way (C) ANOVA with Tukey’s multiple comparison test and unpaired t test (B and F).

