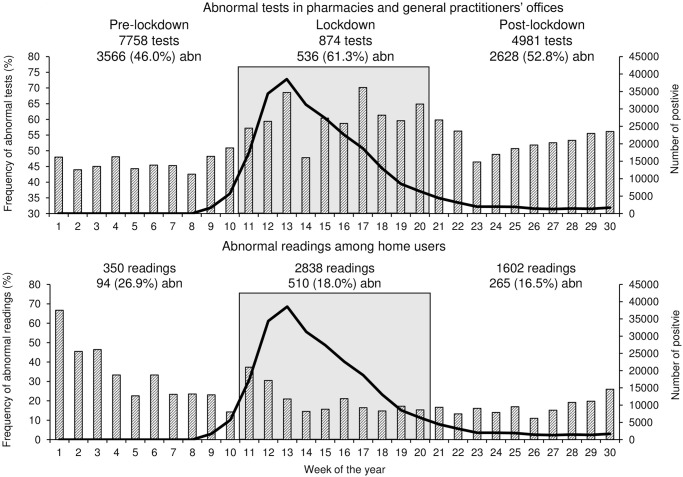
Fig 2. Weekly frequency (%) of abnormal tests in pharmacies and general practitioners’ offices or abnormal readings collected at home (striped bars).
The thick continuous line represents the number of positive to SARS-CoV-2 tests. Pre-lockdown, lockdown, and post-lockdown periods are also identified.

