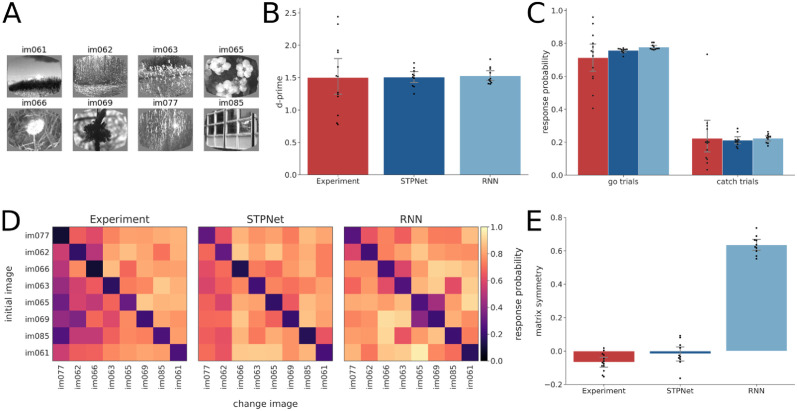
Fig 3. Quantification of behavioral responses in the experiments and the models.
(A) Set of eight images that were used during the task. (B) D-prime values computed for the experiments (red) and the two models (blue). Error bars show 95% confidence intervals on the mean. The same color convention is used throughout all figures. (C) Hit rate (left) and false alarm rate (right) for the experiments and the models. Error bars show 95% confidence intervals on the mean. (D) Average response probability matrices which show the probability of responding to each of the possible 64 image transitions during the task (go trials off the diagonal, catch trials along the diagonal). The experimental response probability matrix shows an asymmetry in the detectability of images, which is partly captured by the STPNet model, but not the RNN model. (E) Quantification of response probability matrix asymmetry. Matrix symmetry is bounded between –1 and 1, with negative values indicating asymmetry and positive values indicating symmetry. The experiments and the STPNet model show a small degree of matrix asymmetry, while the RNN model shows high matrix symmetry. Error bars indicate 95% confidence intervals on the mean.

