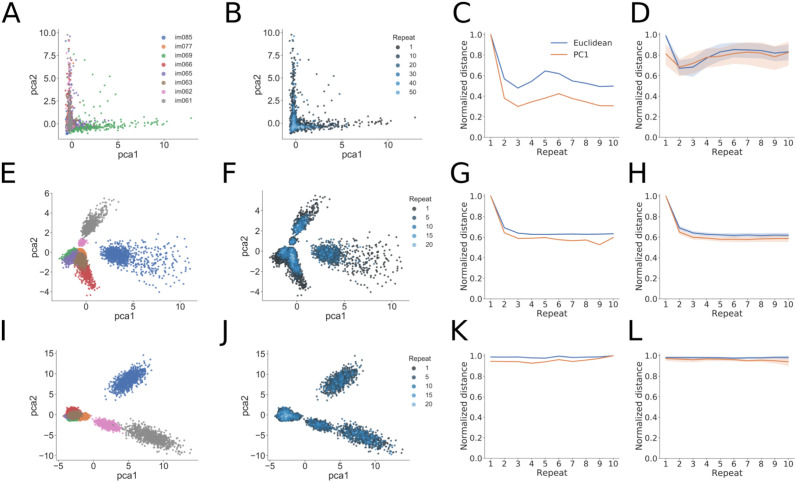
Fig 5. Low-dimensional analyses of population activity for an example experiment and trained examples of the two computational models.
(A) PCA analysis showing projection of population activity onto the first two PCs. Colors label the identity of the shown image and are the same for panels E and I below. The different images can be well separated in this low-dimensional space. (B) The same projection as in panel (A), with the color now showing the number of image repeats (more blue hue indicates higher repeats). Note the difference in number of repeats when compared to panels F and J below. The experiments show a “collapse” toward the origin of the low-dimensional space with increasing number of repeats. (C) Quantification of the population-level adaptation effect as a function of number of repeats. The distance is plotted using either using the Euclidean distance of the full population activity (blue) or the absolute value of the first PC in the low-dimensional space (orange). The experiment shows decreasing distances with repeats, and the fact that the first PC tracks the Euclidean distance indicates a low-dimensional effect. (D) Same convention as in panel (C), now showing the measured distances over all experimental sessions (N = 13). The mean and 95% confidence intervals are shown for each distance plot. (E-H). Same as (A-D), but for the STPNet model, which shows similar trends as for the experiments. (I-L) Same as (A-D), but for the RNN model. The RNN model shows differences with the experiments and STPNet model, mainly a constant distance as a function of image repeats.

