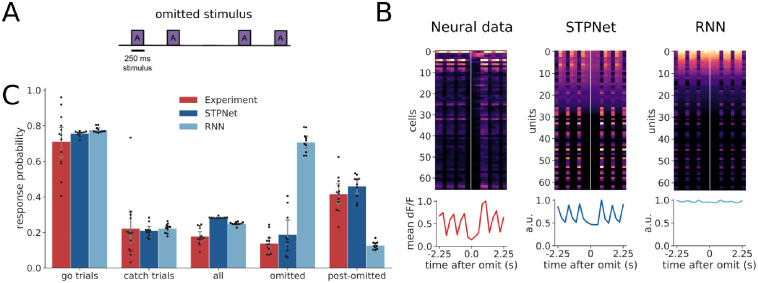
Fig 6. Quantification of response probabilities in the experiments and models.
(A) Schematic of omitted stimulus presentations during the experiments. A small percentage (5%) of stimulus presentations were omitted during the experiment. (B) Example responses centered around the omitted stimulus presentation time, for the experiments and the two computational models. Cells in the experiments and STPNet did not respond during the omission, while many cells in the RNN model were active during the omission. The line plots below show the population average time course. (C) Average response probabilities for go trials, catch trials, all stimulus presentations, omitted stimulus presentations, and post-omitted stimulus presentations. Response probabilities on go trials, catch trials, and all stimulus presentations are similar across the experiments and models. Both the experiments and STPNet model show an elevated response probability following omission (post-omitted stimulus presentations), while the RNN model shows a high response probability on the omitted stimulus presentations. Error bars indicate 95% confidence intervals.

