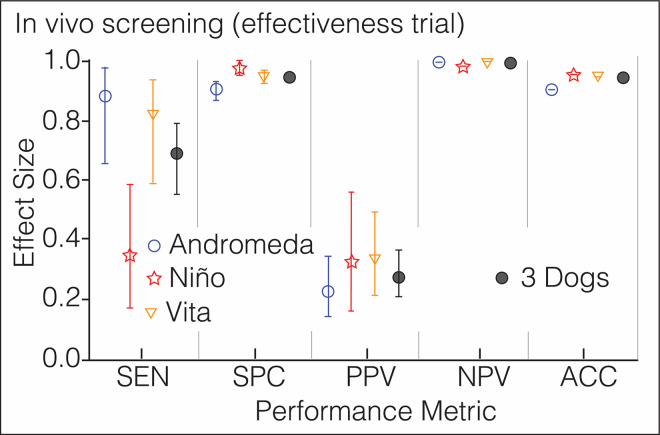
Fig 6. Phase 4: In vivo screening (effectiveness assay).
Performance metrics of 3 dogs screening for COVID-19 the citizens riding the Metro System of Medellin; n 550, prevalence 3.1%. Each symbol has a different color to ease visualization of the dogs. The vertical lines above and below the symbols represent the 95% confidence interval for each metric, which is contained within the symbol for NPV and ACC. Additional numeric data in S5 Table in S1 File.

