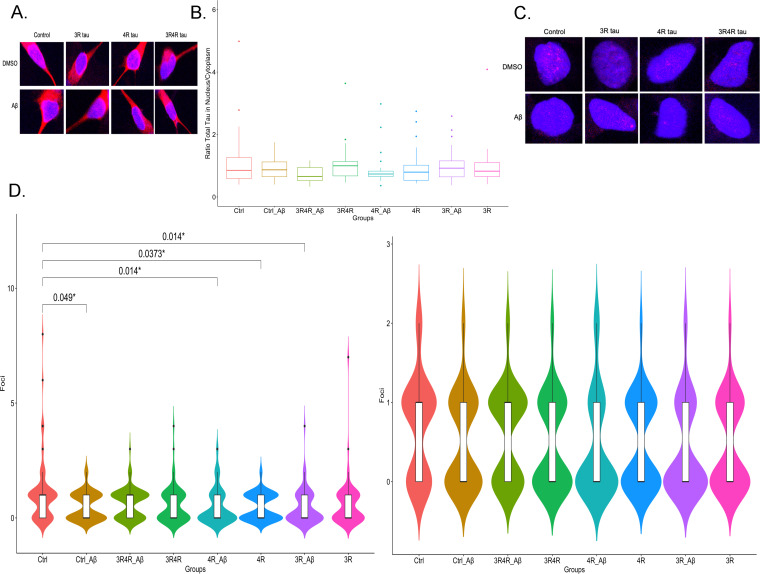
Fig 2. Tau isoform overexpression neither changes total tau localization nor definitively results in DNA damage.
(A) Confocal images (63x objective) of representative samples stained for total tau (red) with nuclei stained with DAPI (blue). (B) Total tau localization between cytoplasm and nucleus does not appear to differ among the conditions examined. (C) Confocal images (63x objective) of representative yH2AX (red) samples with nuclei stained with DAPI (blue). Red nuclear foci indicate where DSBs formed. (D) 4R tau overexpression, 3R tau overexpression with Aβ treatment and Aβ treatment of LV-Ctrl groups appear to correlate with smaller DSB distributions compared to control (N = 3) when outliers are considered (left graph); when they are not considered, these effects do not appear (right graph). All p values were calculated using a Wilcoxon ranked-sum test with multiple corrections done using FDR.

