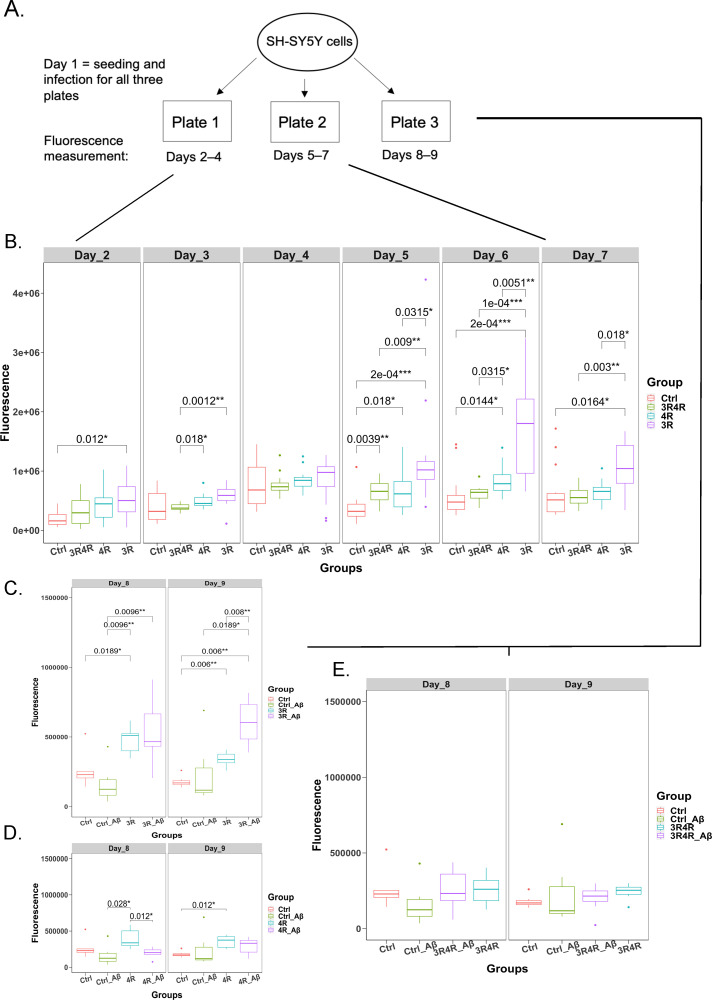
Fig 3. Cytotoxicity of tau isoforms and their interactions with Aβ.
(A) Diagram mapping cytotoxicity assay workflow; plates 1 and 2 measured cytotoxicity through days 2–7, while plate 3 measured cytotoxicity on days 8–9, which captured cytotoxicity changes as a function of Aβ treatment. (B) Comparison of fluorescence values (cytotoxicity proxy, with higher fluorescence signifying greater levels of cell death) over days 2–7 for LV-Ctrl, LV-3R4Rtau, LV-4Rtau, and LV-3Rtau groups. (C) Comparison of fluorescence/cytotoxicity between LV-Ctrl treated with DMSO, LV-Ctrl treated with Aβ, LV-3Rtau treated with Aβ and LV-3Rtau treated with DMSO on days 8–9, plate 3. (D) Comparison of fluorescence/cytotoxicity between LV-Ctrl treated with DMSO, LV-Ctrl treated with Aβ, LV-4Rtau treated with Aβ, and LV-4Rtau treated with DMSO on days 8–9, plate 3. Multiple comparison correction was done using FDR. (E) Comparison of fluorescence/cytotoxicity between LV-Ctrl treated with DMSO, LV-Ctrl treated with Aβ, LV-3R4Rtau treated with Aβ, and LV-3R4Rtau treated with DMSO on days 8–9, plate 3. All p values were calculated using a Wilcoxon ranked-sum test with multiple corrections done using FDR.

