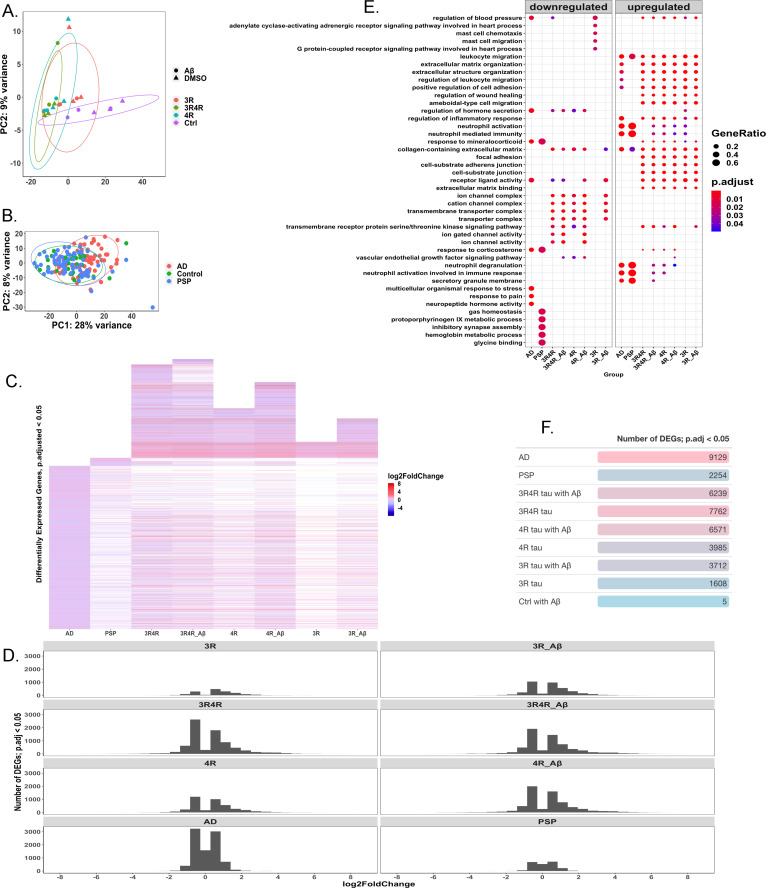
Fig 4. Patterns in differentially expressed genes in AD, PSP, and cell models.
(A) PCA displaying grouping by gene expression between lentivirus and treatment conditions; PC1 accounts for 81% of variance between conditions and there is little separation between Aβ and DMSO-treated groups (N = 3). (B) PCA displaying grouping by gene expression between AD (N = 60), control (N = 33), and PSP (N = 71) patients. PC1 accounts for 28% of variation, with AD patients showing greater separation from control patients than PSP patients do. (C) Heatmap showing log-fold change in expression in genes considered significantly differentially expressed (FDR adjusted p-value<0.05) in each measured group (AD, N = 60; PSP, N = 71; cell groups, N = 3 each) relative to their respective controls (control patients, N = 33 for human disease cases; LV-Ctrl cells for cell conditions, N = 3). White spaces indicate missing gene data, i.e., the genes were not significantly differentially expressed in these groups. LV-Ctrl treated with Aβ cell model is not shown due to too few significantly differentially expressed genes. (D) Graph showing the distribution of log-fold changes among significantly differentially expressed genes (FDR adjusted p-value<0.05) in each condition. (E) Overrepresentation analysis of gene-ontology enriched biological processes, molecular functions, and cellular components, with top terms shown. (F) Table showing number of significantly differentially expressed genes (FDR adjusted p-value<0.05) in each condition.

