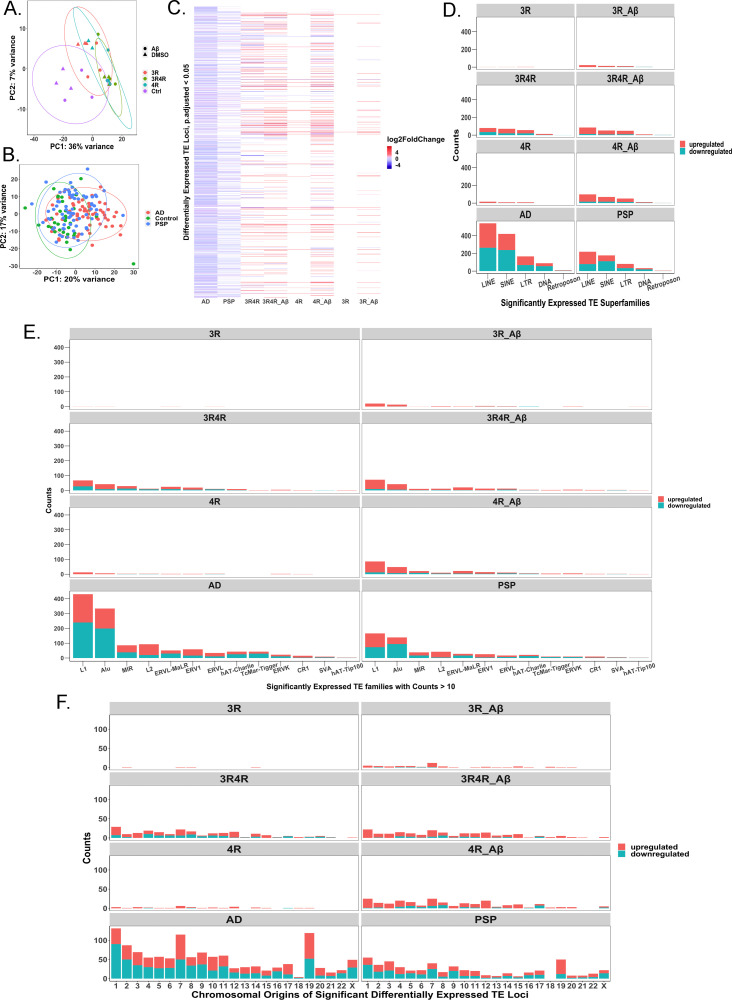
Fig 6. Classification of significantly differentially expressed locus-specific transposable elements by transposable element superfamily and family.
(A) PCA displaying grouping by locus-specific TE expression between lentivirus and treatment conditions; PC1 accounts for 36% of variation between conditions (N = 3). (B) PCA displaying grouping by locus-specific TE expression between AD (N = 60), control (N = 33), and PSP (N = 71) patients. PC1 accounts for 20% of variation, while PC2 accounts for 17% of variation. (C) Heatmap showing log-fold change in expression of TE loci considered significantly differentially expressed (FDR adjusted p-value<0.05) in each measured group (AD, N = 60; PSP, N = 71; cell groups, N = 3 each) relative to their respective controls (control patients, N = 33 for human disease cases; LV-Ctrl cells for cell conditions, N = 3). White spaces indicate missing data, i.e., the TE loci were not significantly differentially expressed in these groups. LV-Ctrl treated with Aβ cell model did not display any differentially expressed TE loci relative to LV-Ctrl and is therefore not included in the heatmap. (D) Counts of significantly differentially expressed TE loci (downregulated and upregulated) per condition grouped by superfamily of TE. (E) Counts (of families with counts > 10) of significantly differentially expressed TE loci (downregulated and upregulated) per condition grouped by TE family. (F) Chromosomal distribution of upregulated and downregulated TE loci on autosomal and X chromosomes.

