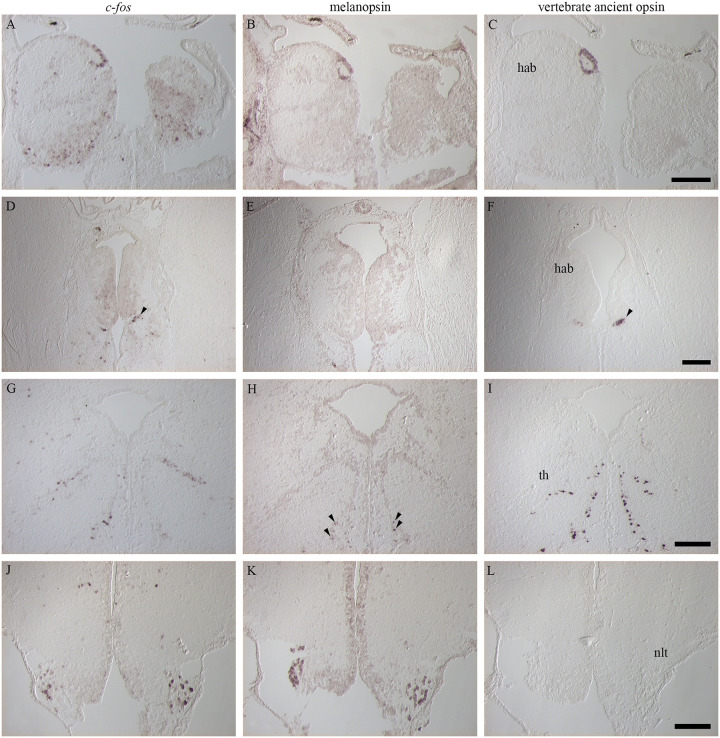
Fig 5. Comparison between activated brain regions, melanopsin and vertebrate ancient opsin (VA opsin) expression following exposure to different narrow bandwidth light treatments.
A-C: In the left habenula (hab) a similar ring of cells was seen for c-fos (A), melanopsin (B) and VA opsin (C). D-F: Ventral of the caudal habenula, a small cluster of cells was detected for c-fos (D) and VA opsin (F) (see arrowheads) but not for melanopsin (E). G-I: In the caudal thalamus (th), a similar expression pattern was seen for c-fos (G) and VA opsin (I) and some melanopsin positive cells (H) (see arrowheads) were also detected. J-L: In the hypothalamus, the lateral cells of the lateral tuberal nucleus (nlt) expressed c-fos (J) after light activation and also melanopsin (K) but not VA opsin (L). Scale bars of 200 μm.

