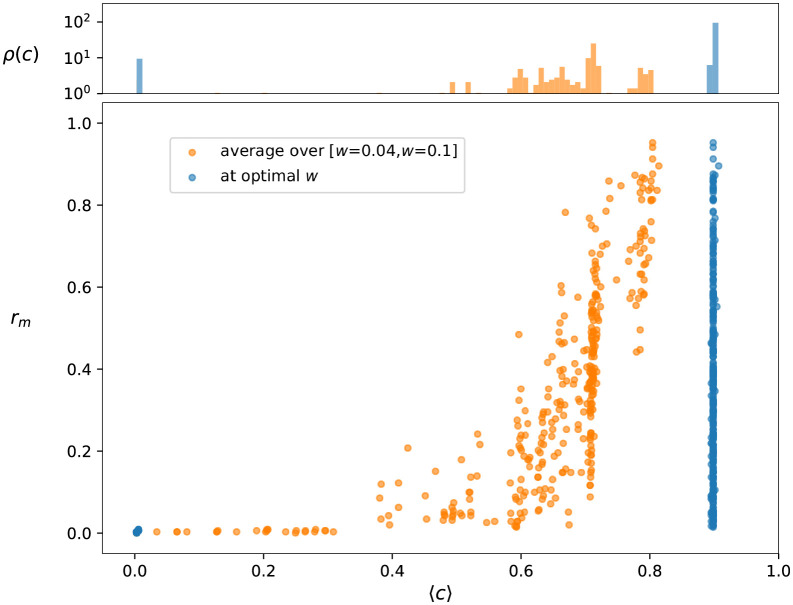
Fig 4. Control centrality and reach.
The main panel shows the reaching centrality rm at m = 3 as a function of the relative control centrality c. Each symbol in the plot is corresponding to an individual CpG dinucleotide (node in the methylation network). In blue we show the results for the methylation network at the optimal weight threshold w*, whereas in case of the orange symbols C(i) was averaged for the individual nodes over 60 different networks obtained by changing the w* parameter in the [w* = 0.04, w* = 0.1] interval. The Pearson correlation coefficient between 〈c〉 and rm is 0.41 for the optimal network, and 0.70 in case of the averaging scenario. The top panel displays the density of the normalised control centrality c for the two cases.

