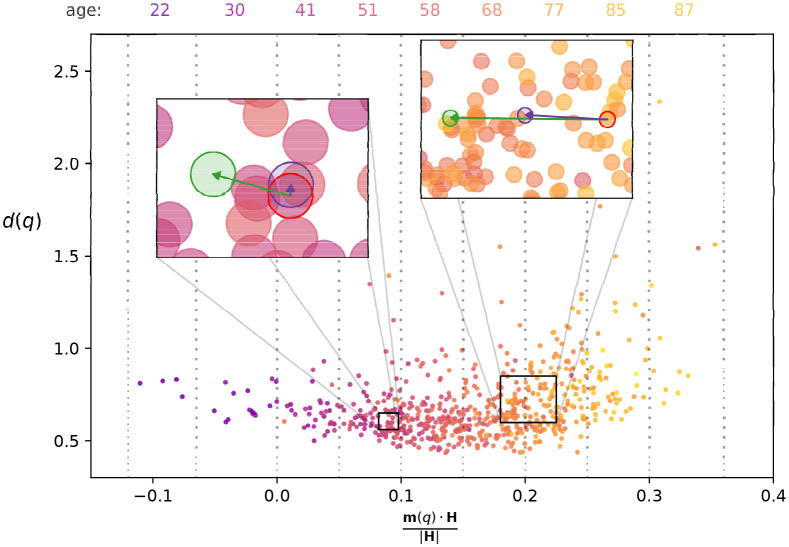
Fig 5. The point cloud of patients in the space of methylation coordinates.
The horizontal axis is showing the projection of the patient vectors m(q) onto H (corresponding to a vector composed of the coefficients of Horvath’s clock), whereas the vertical axis is showing the distance d(q) from the center of mass in the hyper plane perpendicular to H. The colours represent the chronological age, with dark, colder shades indicating younger patients, and bright, warm shades signalling older patients. At the top of the figure we list the average age for the patients in the bins indicated by the dotted vertical lines. The left inset shows the displacement due to perturbing the methylation level of GAP43, with the purple node corresponding to the ℓmax = 0 case, and the green node indicating the ℓmax = 4 case. The right inset is showing the analogous results for perturbing the methylation level of SCGN.

