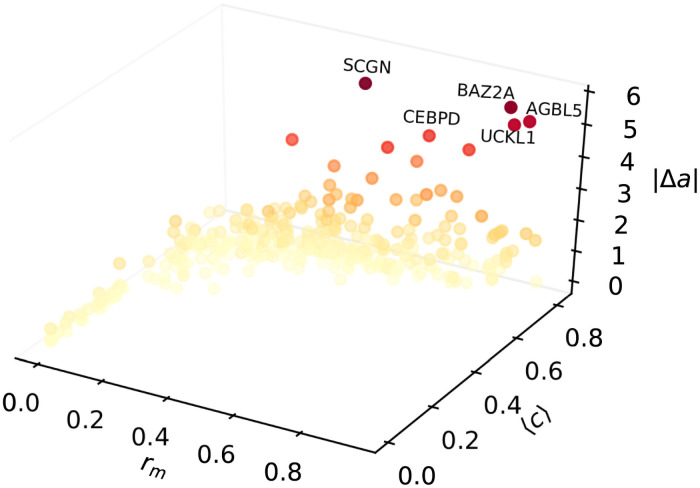
Fig 7. Scatter plot of expected change in the estimated age as a function of the the m-reach and the control centrality.
The vertical axis is corresponding to |Δa|, calculated according to (5), where the initial perturbation Δmi on the methylation level is equal to 2〈σ(m)〉 for all i, and the age derivative for node i is obtained from (4) at ℓmax = 4. On the x axis we display the m-reach rm at m = 3, whereas the y axis is corresponding to the average control centrality 〈c〉. The colouring of the symbols follows their vertical coordinate, with bright colours corresponding to low |Δa| values, and darker shades representing a larger expected change in a.

