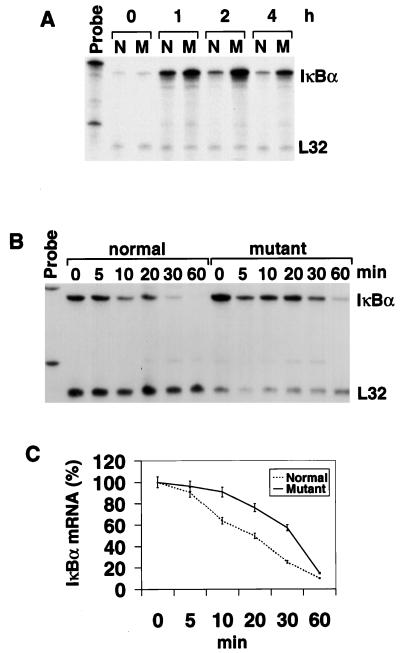
FIG. 2.
Analysis of IκBα mRNA expression in fibroblasts. (A) IκBα mRNA expression in normal (N) and relb−/− (M) fibroblasts treated with LPS for different periods. (B) Analysis of IκBα mRNA stability in LPS-treated fibroblasts. Normal and mutant fibroblasts were treated with LPS for 1 h before actinomycin D was added to stop mRNA synthesis. Cells were harvested at 5, 10, 20, 30, and 60 min after the addition of actinomycin D and analyzed for IκBα mRNA levels by an RNase protection assay. (C) Graphic representation of the IκBα mRNA half-life. The IκBα and L32 bands in panel B were quantitated by phosphorimager scanning. The count of each IκBα band was factored by that of the corresponding L32 band. The final value of each time point is expressed as a percentage of that at time zero.

