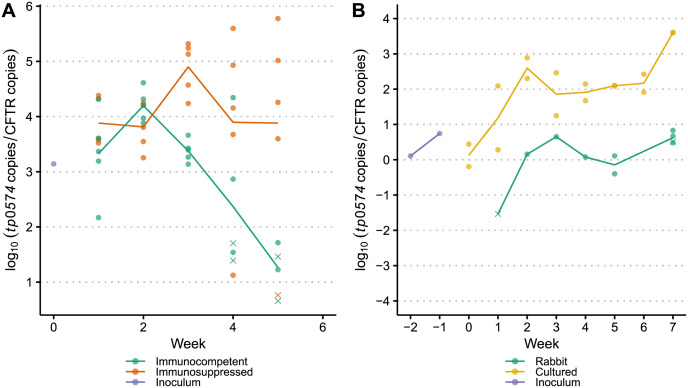
Fig 3. Log copy numbers for samples passaged in (A) immunosuppressed vs. immunocompetent rabbits and (B) immunocompetent rabbit vs. in vitro culture system.
Each unique sample is represented by either a dot or a cross, where a cross indicates that we were unable to successfully recover sequence from the sample. Lines show the mean normalized treponemal load, as quantified by the log ratio of tp0574 copies to CFTR copies and are grouped and color-coded by passage type.

