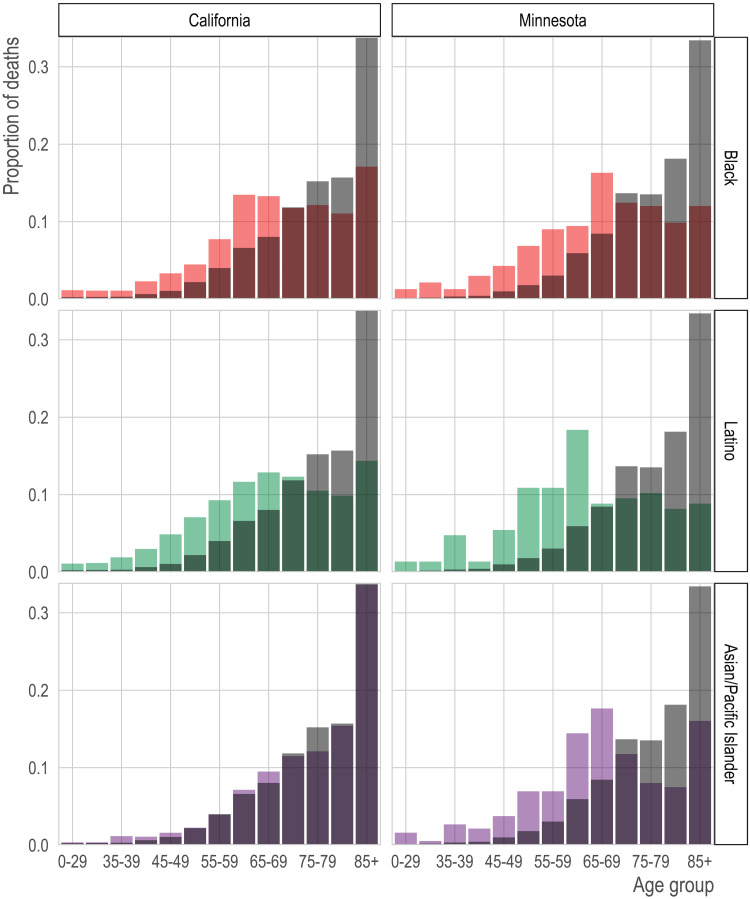
Fig. 2. Age distribution of COVID-19 deaths by race/ethnicity and state.
We show the proportion of COVID-19 deaths (y axis) in each age group (x axis) by race/ethnicity (rows) for California (left column) and Minnesota (right column). The gray bars in the background of each panel show the age distribution of deaths in the non-Hispanic white population for comparison.

