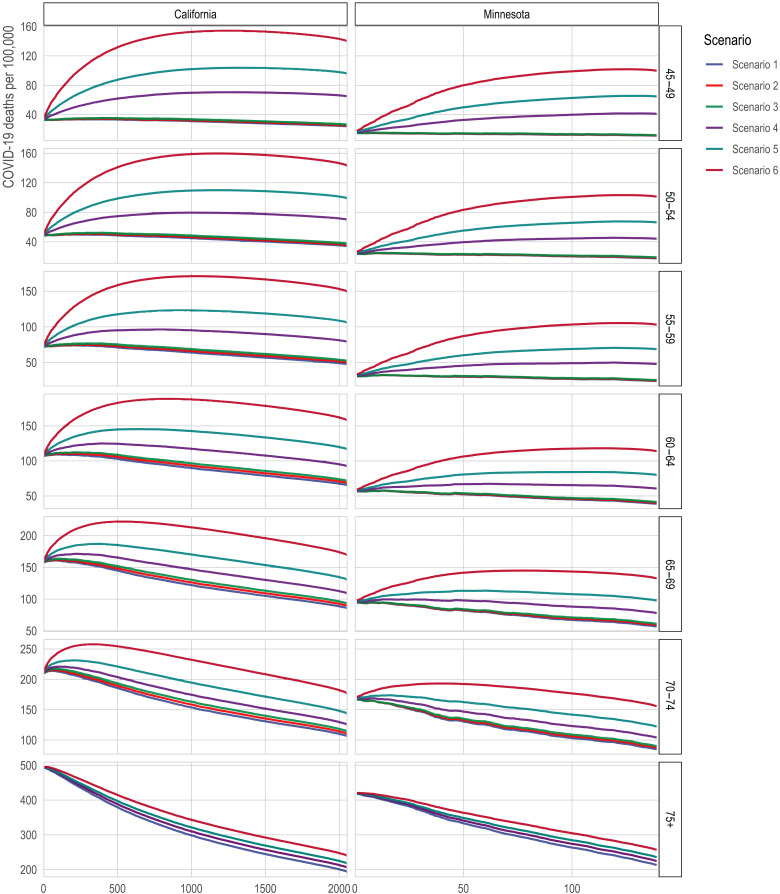
Fig. 5. Death rates from COVID-19 among the eligible with direct targeting of high-mortality Census tracts.
The x axis is the number of tracts in which all adults (ages 20+) are prioritized for vaccination. The y axis is 2020 COVID-19 deaths per 100,000; a higher death rate among the eligible indicates better targeting of vaccines toward high-risk individuals. The lines correspond to alternative scenarios as described in Materials and Methods.

