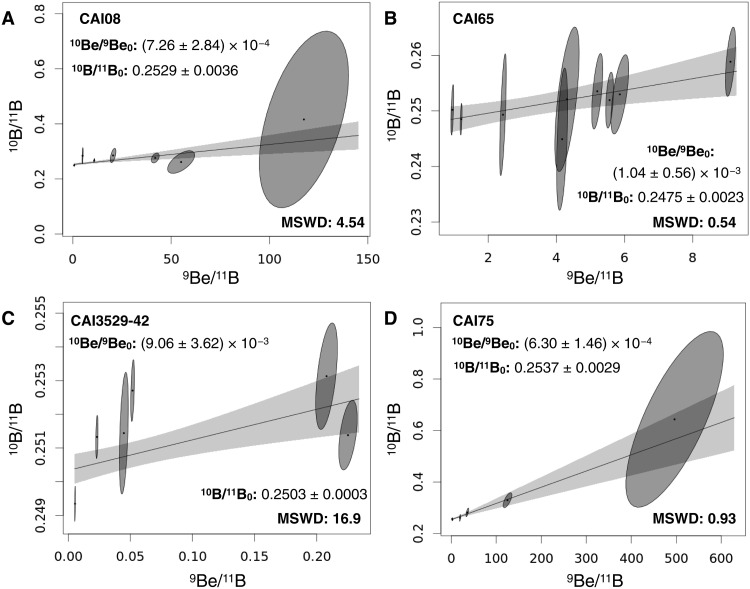
Fig. 2. 10Be-10B isochrons of coarse-grained CAIs analyzed in this study.
Samples CAI08, CAI65, CAI3529–42, and CAI75 are shown in panels (A), (B), (C), and (D), respectively. In each panel, the solid line and associated 2σ envelope represent the error-weighted least square fit through the data (90). Corresponding slopes and y intercepts are reported together with MSWD values. Chondritic 10B/11B: 0.2481 (91). All uncertainties are given as 2σ.

