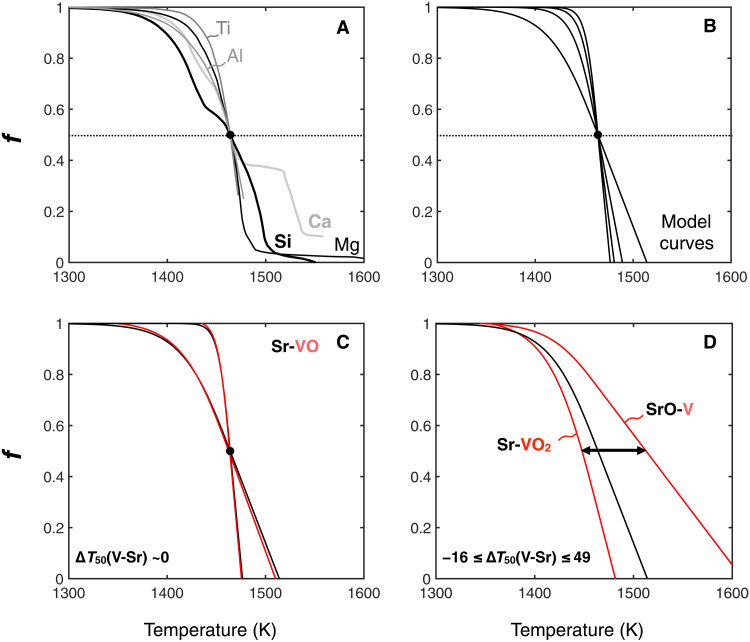
Fig. 4. A priori approach aimed at constraining the potential difference between the T50 of V and Sr using the (V) – (Sr) linear functions required to reproduce the δ51V-δ88Sr CAI correlation line.
(A) Expected condensation curves of major elements [Ca, Si, Mg, Ti, and Al; (52)] normalized to a T50 of 1464 K. (B) Condensation curve profiles used in the present study to investigate potential differences between the T50 of V and Sr (see main text). These different profiles allow investigating condensation curves spanning the entire range of slopes observed for major elements. (C) The two black curves represent the two most extreme scenarios for the potential slope of the Sr condensation curve. Expected VO condensation curves are then built based on Table 1 [f(V) = 1.0513 × f(Sr) − 0.0406]. In this case, similar condensation curves for Sr and VO would be required to explain the δ51V-δ88Sr correlation line observed in CAIs [∆T50(V-Sr) ~ 0; Table 1]. (D) The two red curves represent the expected condensation curves of VO2 and V in the case of Sr-VO2 and SrO-V binary systems, respectively (Table 1). The black line corresponds to the condensation line of the Sr-bearing species. In this case (most gentle slope), ∆T50(V-Sr) range from −16 K to +49 K.

