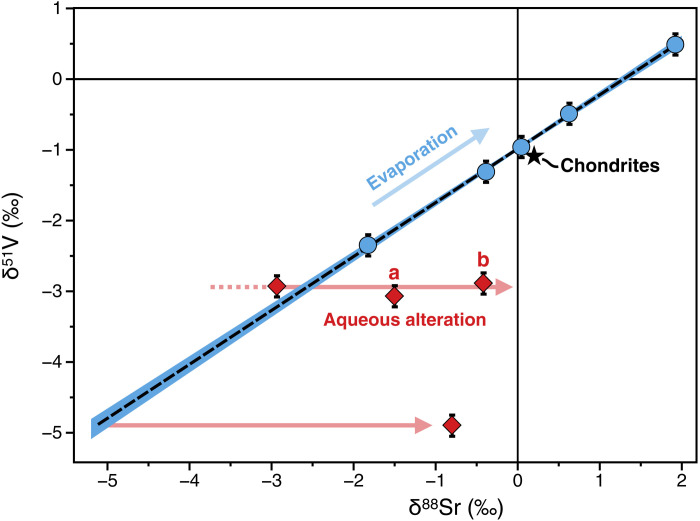
Fig. 5. δ51V and δ88Sr isotopic composition of fine- and coarse-grained CAIs (represented by red diamonds and blue circles, respectively).
The black dashed line and its blue envelope represent the best fit and associated 95% CI, respectively, of the linear regression through all coarse-grained CAIs [δ51V = (−0.9835 ± 0.026) + (0.7623 ± 0.022) × δ88Sr, R2 = 0.999]. The chondritic composition (34, 40, 41) is indicated by the black star for reference. The two samples labeled “a” and “b” represent two fragments of the fine-grained CAI01. Errors are given as 2σ. The blue line represents the possibility that the correlation line through coarse-grained CAIs is mainly controlled by kinetic isotope fractionation during evaporation. In the framework of our model, most of the fine-grained CAIs are displaced toward higher δ88Sr values due to partial equilibration of the δ88Sr with aqueous fluids of chondritic composition [i.e., δ88Sr = 0.2‰; (40, 41)].

