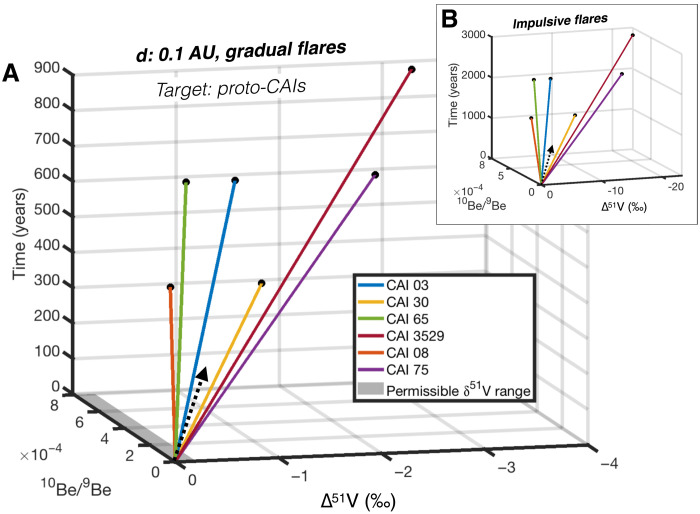
Fig. 6. Three-dimensional (3D) diagram of the trajectories of proto-CAIs, in 10Be/9Be, Δ51V = δ51V − δ51Vinit (‰), and time (years) space, in the case of in situ irradiation at 0.1 AU.
Irradiation by gradual and impulsive flares is shown in panel (A) and panel (B), respectively. The difference trajectories of CAIs, which all reach the canonical 10Be/9Be of ~8 × 10⁻⁴ (black dots), are controlled by their distinct abundances of target elements for cosmogenic production (Supplementary Materials). Note that all of these six CAIs plot on the δ51V versus δ88Sr correlation line (Fig. 1). The permissible range of δ51V variation (~0.2‰) is represented by the gray area. Dashed arrows show the general direction of 10Be and 50V irradiative production. 2D projections of (A) and (B) are provided in the Supplementary Materials to facilitate readability.

