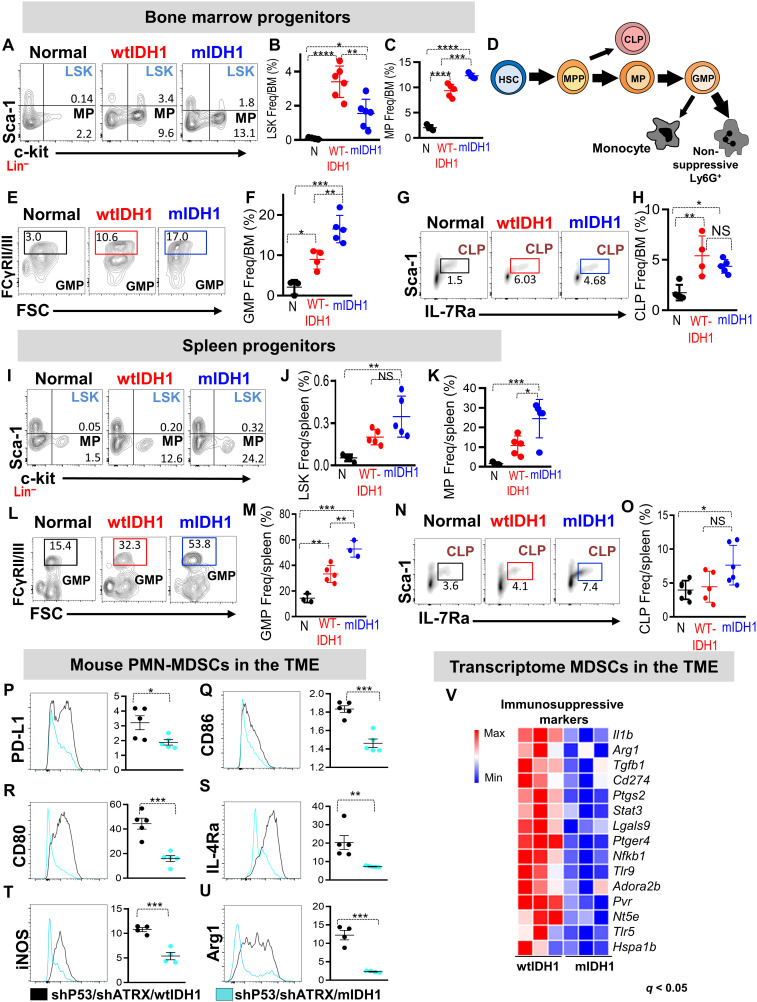
Fig. 3. Phenotypic and molecular characterization of myeloid cell lineages in mIDH1 glioma.
(A to C) Representative flow cytometry plots and quantification of the percentage of (B) LSK (Lin−/c-Kit+/Sca-1+) and (C) MP (Lin−/c-Kit+/Sca-1−) in BM from normal mice (N), and mice implanted with wtIDH1 or mIDH1 neurospheres. (D) Schematic diagram representing the shift in myelopoeisis within mIDH1 tumor–bearing mice. Thick arrows represent predominant developmental pathways in mIDH1 tumor–bearing mice. (E to H) Flow cytometry analysis of the frequency of (E and F) GMPs (Lin−/IL-7Rα−/c-Kit+/Sca-1−/CD34+/FcyRII/IIIhigh) and (G and H) CLPs (c-Kitlow/Sca-1low/Lin−/IL-7Rα+) in the BM from normal and wtIDH1 or mIDH1 tumor–bearing mice. (I to K) Representative flow cytometry plots and quantification of the percentage of (J) LSK and (K) MPs in spleen from normal and wtIDH1 or mIDH1 tumor–bearing mice. (L and M) Representative flow cytometry plot and quantitation analysis showing the frequency of common GMPs in spleens from normal mice and wtIDH1 and mIDH1 tumor–bearing animals. (N and O) Representative flow cytometry plot and quantitation analysis showing the frequency of CLPs in spleens from normal mice, wtIDH1 and mIDH1 tumor–bearing mice. (P to U) Flow cytometry analysis of immunosuppressive/costimulatory markers in the CD45high/CD11b+/Ly6G+ population within TME of wtIDH1 (black) or mIDH1 (blue). (V) Heatmap showing the normalized expression of genes related to PMN-MDSC immunosuppressive signature in myeloid cells (CD11b+/ Gr-1+) from wtIDH1 or mIDH1 TME. *P < 0.05, **P < 0.01, ***P < 0.005, and ****P < 0.0001, one-way ANOVA.

