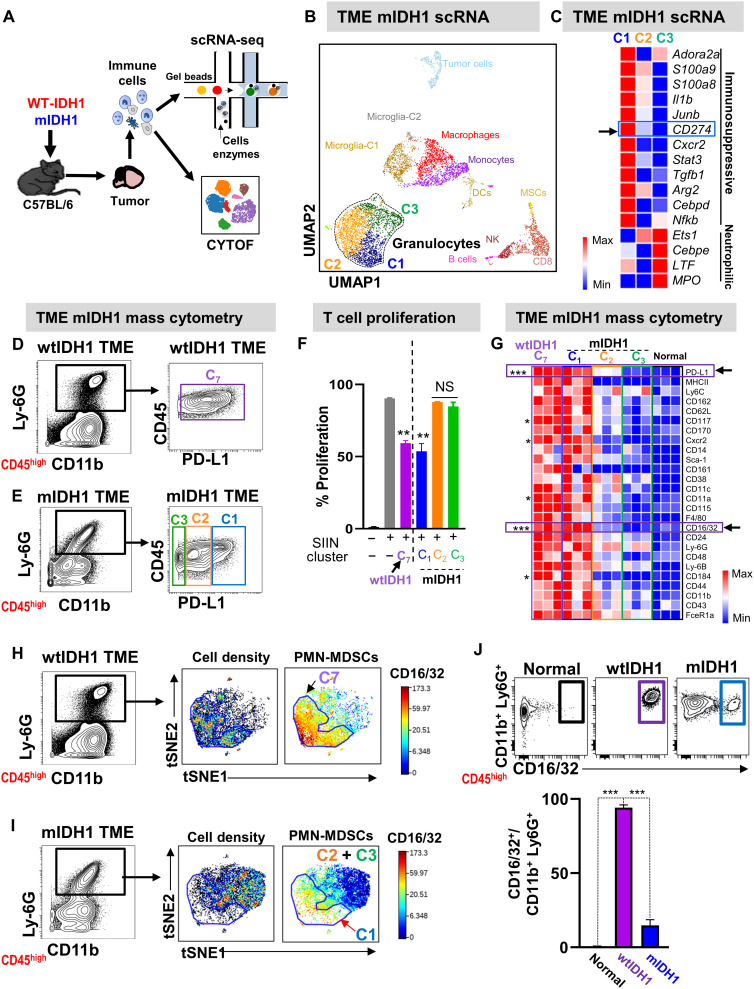
Fig. 4. Nonsuppressive neutrophils and preneutrophils are the major granulocyte population in mIDH1 tumors.
(A) Schematic overview of single-cell sequencing and CyTOF analysis of immune cells infiltrating wtIDH1 and mIDH1 tumors. (B) Combined Seurat analysis of immune cells from mIDH1 shown in Uniform Manifold Approximation and Projection (UMAP) projection results in various distinct clusters of immune cells (N = 2). (C) Heatmap of differentially expressed immunosuppressive and neutrophil-related genes between the three granulocytic clusters in mIDH1 TME. (D and E) Mass cytometry analysis of granulocytes from TME of (D) wtIDH1 or (E) mIDH1 tumors. (F) T cell proliferation analysis to assess the inhibitory potential of myeloid cells cluster (C7) from wtIDH1 tumors and C1, C2, and C3 myeloid cell clusters isolated from mIDH1 tumors. (G) Heatmap representing normalized expression level of myeloid biomarkers within granulocytes from the TME of normal mice, mice implanted with wtIDH1 tumors, and C1, C2, and C3 clusters from the TME of mIDH1 tumors. (H and I) Unsupervised clustering and viSNE visualization of granulocytes from wtIDH1 (H) or mIDH1 (I) tumors using the biomarker shown in (G). (J) Flow plots and quantitation analysis of the proportion of bona fide PMN-MDSCs (CD45high/CD11b+/Ly6G+/CD16/32+) infiltrating normal mice and wtIDH1 or mIDH1 tumors. *P < 0.05, **P < 0.01, ***P < 0.005, ANOVA.

