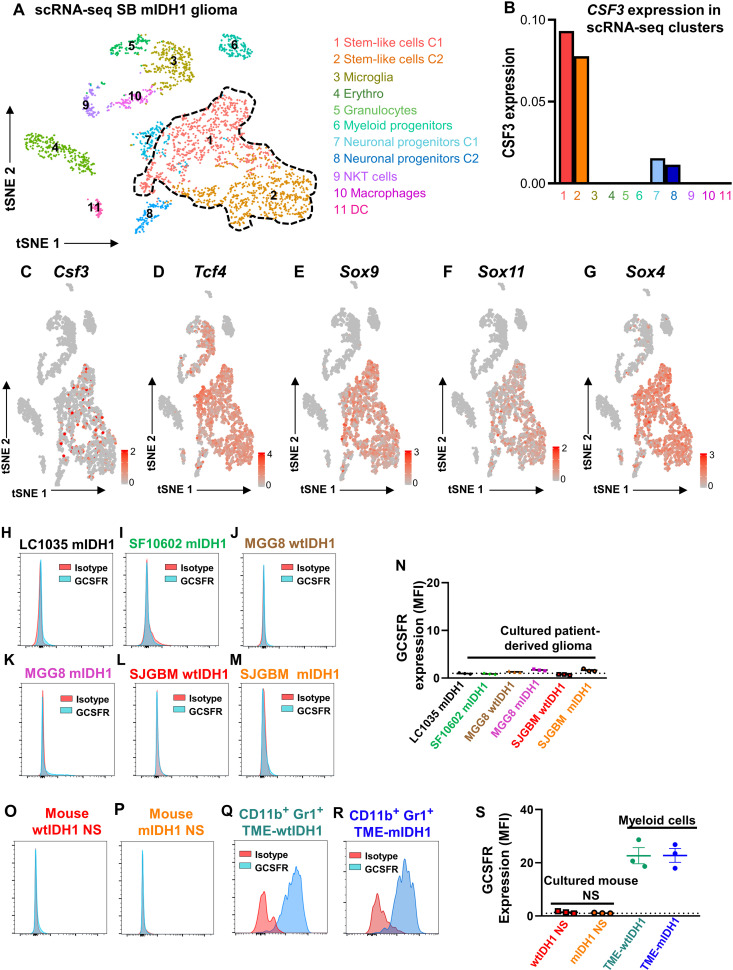
Fig. 8. Glioma mIDH1 stem-like cells are the major source of G-CSF expression.
(A and B) Combined Seurat analysis shown in tSNE projection of whole tumor from mIDH1 GEMM of glioma resulted in various distinct clusters of cells. The expression of CSF3 was analyzed between the clusters. Stem-like cells were the major clusters that have the highest CSF3 expression (N = 2). (C to G) Feature plots represent the expression of (C) csf3, (D) tcf4, (E) sox9, (F) sox11, and (G) sox4. (H to M) Flow cytometry analysis of the GCSFR expression in glioma patient-derived cells with wtIDH1 or mIDH1. (N) Quantification of GCSFR expression in cultured human glioma cells with wtIDH1 or mIDH1. MFI, Mean fluorescence intensity. (O and P) Flow cytometry analysis of the GCSFR expression in mouse neurospheres developed by the SB model with wtIDH1 or mIDH1. (Q and R) Flow cytometry analysis of the GCSFR expression on CD11b+ Gr-1+ derived from the TME of wtIDH1 or mIDH1 tumor–bearing mice. (S) Quantification of GCSFR expression in conditions (O) to (R).

