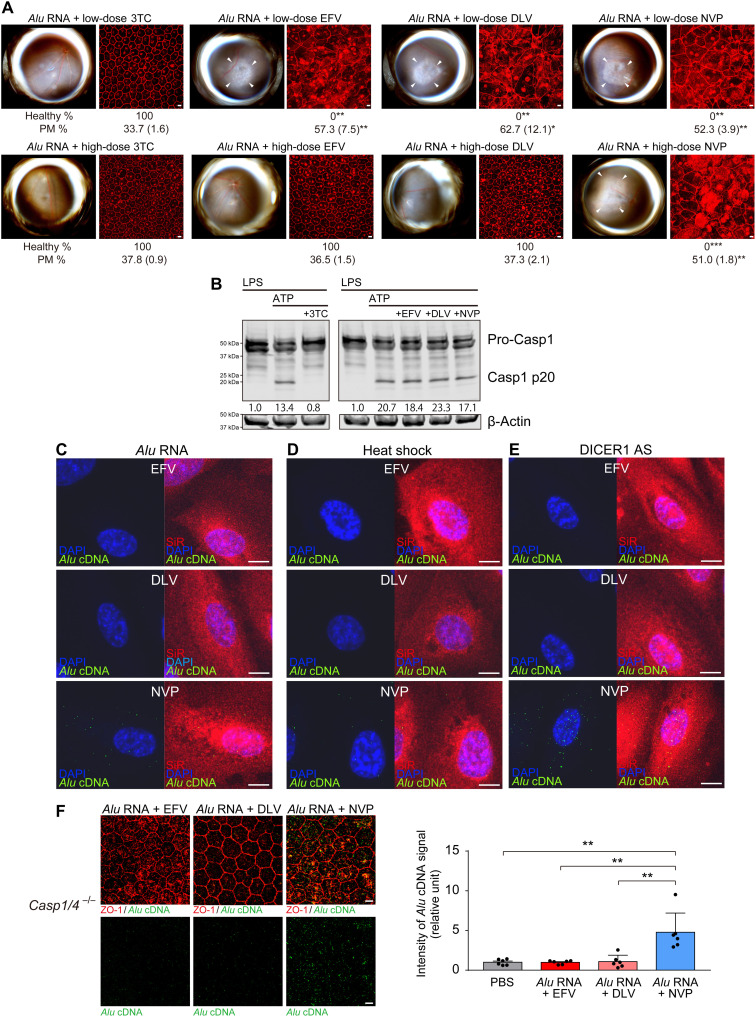
Fig. 6. Effects of NonNRTIs on Alu cDNA synthesis.
(A) RPE degeneration (fundus photos, left; ZO-1 flat mounts, right) in WT mice after treatment with low doses (50 pmol) of 3TC, EFV, DLV, or NVP (top row) and with high doses (500 pmol) of 3TC, EFV, DLV, or NVP (bottom row). ZO-1 (red). Scale bars, 10 μm. n = 6. Binary and morphometric quantification of RPE degeneration are shown. (*P < 0.05; **P < 0.01; ***P < 0.001, Fisher’s exact test for binary; two-tailed t test for morphometry). PM, polymegethism [mean (SEM)]. Arrowheads in fundus images denote the boundaries of RPE hypopigmentation. (B) Detection of caspase-1 activation by immunoblotting of primary mouse bone marrow–derived macrophages (BMDMs) treated with LPS and ATP, in the presence of 3TC, EFV, DLV, or NVP. Densitometry of the bands corresponding to active caspase-1 (Casp1 p20) normalized to loading control (β-actin). (C to E) In situ hybridization of Alu cDNA (green) in primary human RPE cells after treatment with in vitro transcribed Alu RNA, DICER1 antisense oligonucleotides (DICER1 AS), or heat shock after treatment with high doses of EFV, DLV, and NVP. SiR (F-actin, red), DAPI (blue). Scale bars, 10 μm. (F) In situ hybridization to detect Alu cDNA (green) of RPE whole mounts from Casp1−/− Casp4−/− mice after subretinal administration of in vitro–transcribed Alu RNA after treatment with EFV, DLV, or NVP. ZO-1 (red). Scale bars, 10 μm. Bar graph (right) of signal intensity. **P < 0.01 by Mann-Whitney U test. Error bars show SEM. n = 6.

