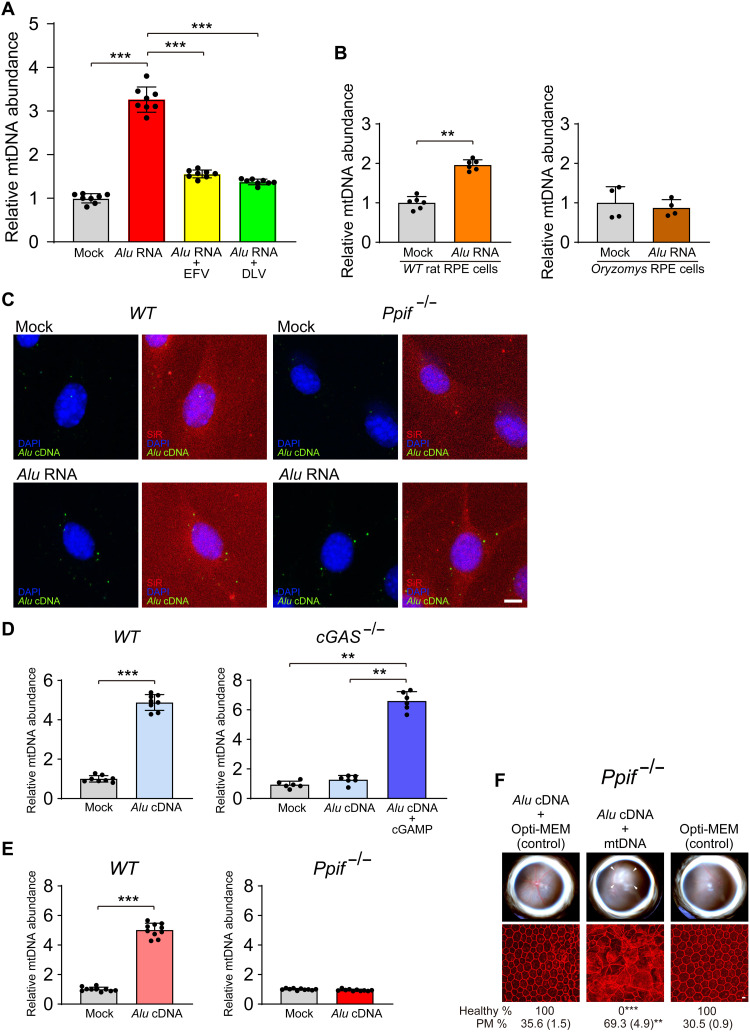
Fig. 8. Alu cDNA-induced mtDNA release is cGAS-dependent.
(A and B) mtDNA was quantified in cytoplasmic DNA free of intact mitochondria and normalized to mock-treated cells as described previously (12) in (A) mouse RPE cells after transfection with Alu RNA following treatment with RT inhibitors (EFV or DLV) or (B) O. palustris cells lacking functional genomic L1 loci. This cytoplasmic DNA was subjected to 12S and 16S mtDNA qPCR. n = 4 to 8. **P < 0.01; ***P < 0.001 by Mann-Whitney U test. Error bars show SEM. (C) In situ hybridization of Alu cDNA (green) in primary mouse RPE cells (WT and Ppif−/−) transfected with Alu RNA. DAPI (blue), SiR (F-actin, red). Scale bar, 10 μm. (D) Quantification of mtDNA release induced by Alu cDNA in WT and cGAS−/− MEFs. Transfection of cGAMP into cGAS−/− MEFs restored Alu cDNA–induced mtDNA release (right, dark blue bar); n = 8. **P < 0.01; ***P < 0.001 by Mann-Whitney U test. (E) mtDNA release in WT and Ppif−/− mouse RPE cells. n = 9 to 10. ***P < 0.001 by Mann-Whitney U test. (F) RPE degeneration after Alu cDNA administration in Ppif−/− mice with or without coadministration of mtDNA. Fundus photos, top; flat mounts stained for ZO-1 (red), bottom. White arrowheads indicate degenerated area in the fundus image. Scale bar, 10 μm. Binary and morphometric quantification of RPE degeneration are shown (**P < 0.01; ***P < 0.001, Fisher’s exact test for binary; two-tailed t test for morphometry). PM, polymegethism [mean (SEM)]. Arrowheads in fundus images denote the boundaries of RPE hypopigmentation.

