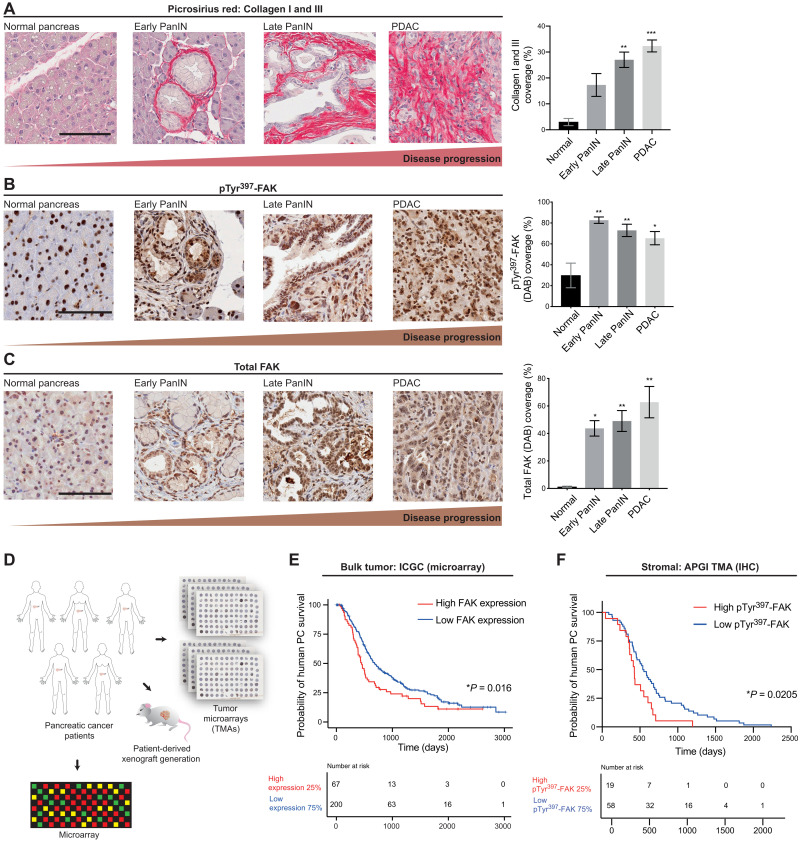
Fig. 1. ECM abundance and FAK expression and activity increase throughout PDAC progression, providing a rationale to target tumor-ECM feedback in PC.
(A to C) Representative images of normal pancreas, early Pancreatic intraepithelial neoplasia (PanIN), late PanIN, and PDAC tissue (scale bars, 100 μm) and quantification of collagen I/III coverage (Picrosirius red) (A), phosphorylated (pTyr397) FAK (DAB) (B), and total FAK expression (DAB) (C). n ≥ 3 mice per stage and n ≥ 3 fields of view (FOVs) per stage per mouse. Results: means ± SEM. P values were determined using an ordinary one-way analysis of variance (ANOVA) with Tukey correction for multiple comparisons, and significance is compared to normal pancreas. (D) Schematic representation of patient-derived xenograft (PDX) and parallel TMA establishment. (E) Kaplan-Meier analysis of human PC disease survival based on FAK expression (microarray) with high FAK (red) versus low FAK (blue) in the ICGC cohort. (F) Kaplan-Meier analysis of deceased human PC patient survival with low Picrosirius red staining and high pTyr397-FAK (red) versus low pTyr397-FAK (blue) in the APGI cohort. Patients who died of surgical complication or whose deaths were non–cancer-related were excluded from the analysis. Significance was determined using a Kaplan-Meier analysis of survival compared using a log-rank test. *P < 0.05, **P < 0.01, and ***P < 0.001.

