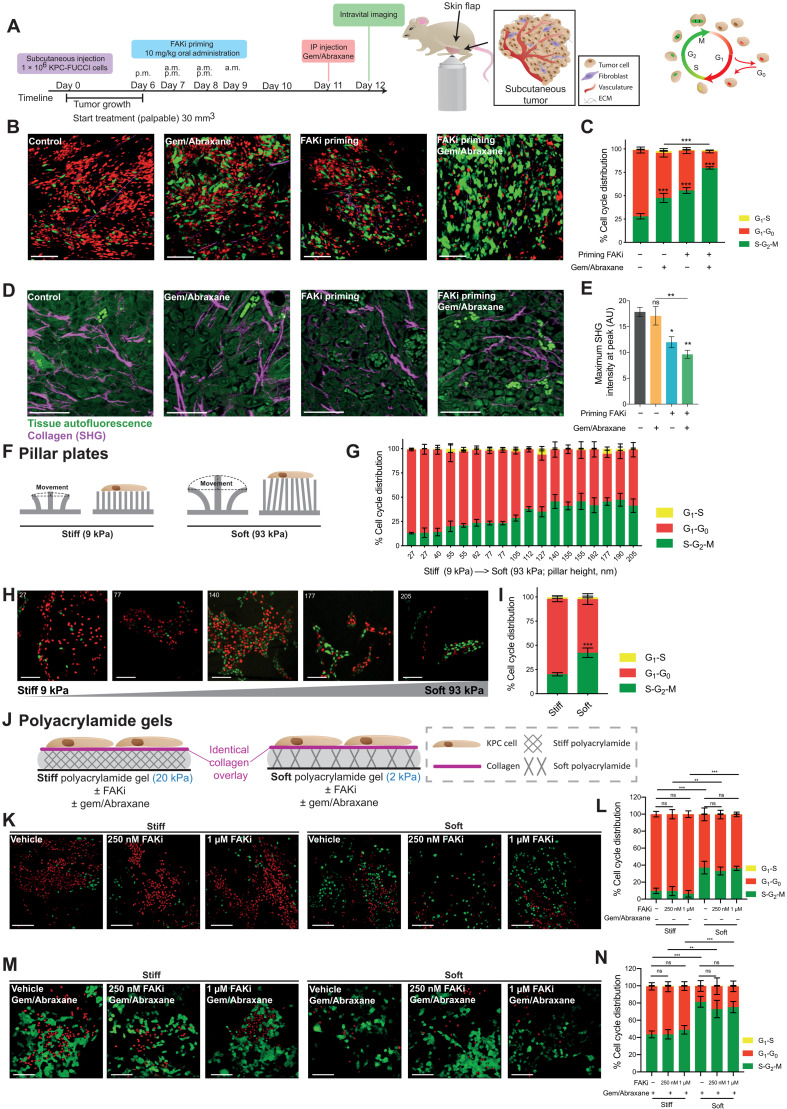
Fig. 5. FAKi priming improves KPC tumor response to gemcitabine/Abraxane in vivo, which may partially be driven by a “softening” of the tumor microenvironment.
(A) Timeline of subcutaneous KPC-FUCCI xenografts with intravital imaging of FUCCI cell cycle reporter in surgically exposed tumors. IP, intraperitoneal. (B and C) Representative FUCCI images (B) and quantification (C) in tumors primed with vehicle or FAKi followed by saline or gemcitabine/Abraxane. Scale bars, 50 μm. (D and E) Representative maximum projections of SHG signal (magenta) and tumor cells (green) (scale bars, 100 μm) (D) and quantification of peak SHG signal intensity (E). n = 5 animals per treatment group, 15 (B and C) and 5 FOVs (D and E) per animal. (F) Schematic of stiff and soft pillar plates. (G to I) Quantification (G), representative images (H) (scale bars, 50 μm), and pooled average cell cycle phase distribution (I) of FUCCI reporter in KPC-FUCCI cells grown on pillars of varying heights. Numbers indicate pillar height (increasing softness from left to right). Micropatterned cell surface interface differs for repeated pillar heights. n = 3 repeats, 1 height per micropattern per repeat, 5 FOVs per replicate. (J) Schematic of cancer cells seeded onto collagen-coated stiff (20 kPa) and soft (2 kPa) hydrogels. (K to N) Representative FUCCI images (K and M) (scale bars, 50 μm) and quantification (L and N) in KPC-FUCCI cells seeded onto hydrogels treated with vehicle or FAKi followed by saline (K and L) or gemcitabine/Abraxane (M and N). n = 3 biological repeats, 2 hydrogels per repeat per treatment group, 5 FOVs per gel. Results: means ± SEM. P values were determined using a two-way ANOVA (C, I, L, and N) and one-way ANOVA (E) with Tukey correction for multiple comparisons. ns, P > 0.05; *P < 0.05, **P < 0.01, and ***P < 0.001.

