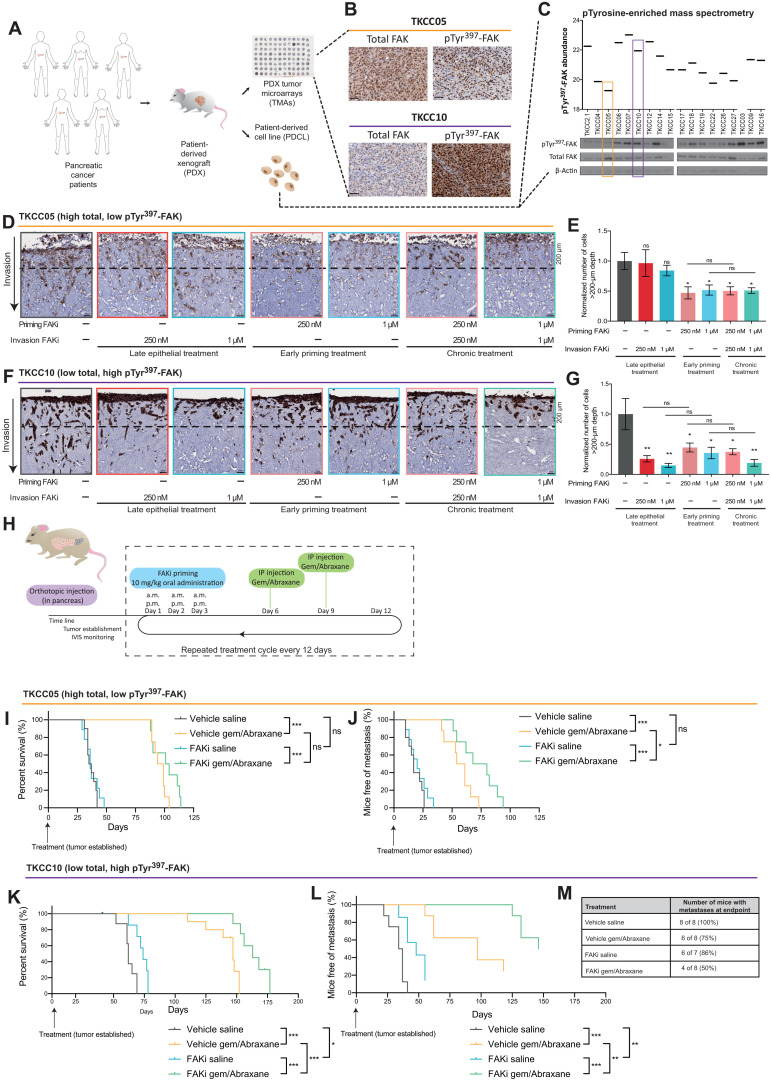
Fig. 7. A FAK signature reveals a graded response to stromal and epithelial FAKi priming before gemcitabine/Abraxane.
(A) Schematic representation of PDAC PDX, PDCL, and PDX TMA establishment. (B) Representative images of TKCC05 and TKCC10 PDX TMA samples stained with total and pTyr397-FAK. Scale bars, 50 μm; n = 3 cores per PDX. (C) Quantification of pTyr397-FAK levels in PDCLs [mass spectrometry, top; data obtained from (67)] and confirmation via Western blot (bottom), highlighting TKCC05 (orange; low active, high total FAK) and TKCC10 (purple; high active, low total FAK) cells. (D to G) Representative images (D and F) and quantification (E and G) (normalized cell number at >200-μm depth) of green fluorescent protein (GFP)–stained TKCC05 cells (D and E) and pan-cytokeratin–stained TKCC10 cells (F and G) invading into organotypic matrices primed with vehicle or FAKi (dotted line, 200-μm invasion depth). Scale bars, 50 μm. n = 3 biological repeats, 3 matrices per repeat, 3 FOVs per matrix. Results: means ± SEM. P values were determined using an ordinary one-way ANOVA with Tukey correction for multiple comparisons. Unless otherwise stated, all significance is compared to vehicle. (H) Timeline for TKCC05 and TKCC10 orthotopic studies. IVIS, In Vivo Imaging System. (I to L) Kaplan-Meier analysis of survival (I and K) and time to metastasis (J and L) in mice with TKCC05 (I and J) or TKCC10 (K and L) orthotopic tumors treated with vehicle/saline (TKCC05, n = 10; TKCC10, n = 8), vehicle/gemcitabine/Abraxane (TKCC05, n = 9; TKCC10, n = 8), FAKi/saline (TKCC05, n = 8; TKCC10, n = 7), or FAKi/gemcitabine/Abraxane (TKCC05, n = 8; TKCC10, n = 8 animals). (M) Percentage of TKCC10 mice with visible liver metastases at endpoint. Kaplan-Meier curves were compared using log-rank Mantel-Cox test. ns, P > 0.05; *P < 0.05, **P < 0.01, and ***P < 0.001.

