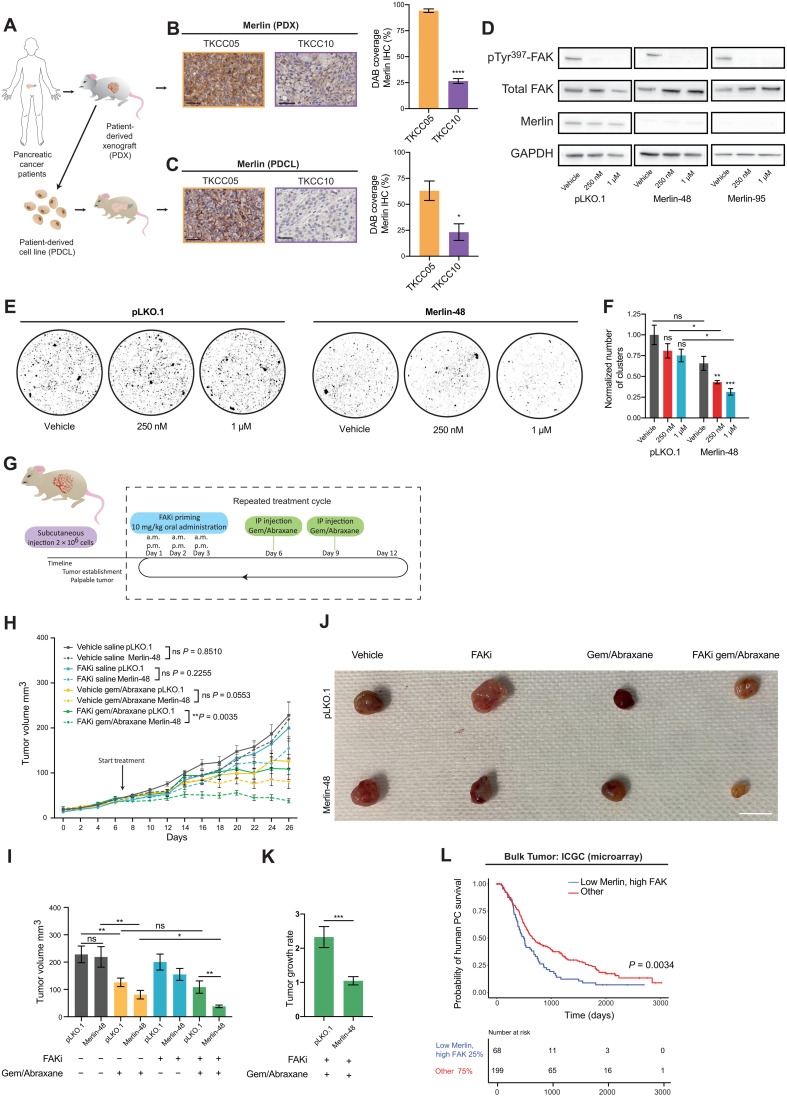
Fig. 8. Manipulation of Merlin can sensitize nonresponsive patient-derived tumors to FAKi before chemotherapy and induce disease stabilization.
(A) Schematics of establishment of PDXs, PDCLs, and PDCL-generated orthotopic tumors. (B and C) Representative Merlin-stained images and quantification of TKCC05 (orange) and TKCC10 (purple) PDX (B) and PDCL-generated tumors (C). Scale bars, 50 μm. (D) Western blot of pTyr397-FAK, total FAK, and Merlin in TKCC05 pLKO.1, Merlin-48, and Merlin-95 cells on CDMs treated with vehicle or FAKi. n = 3 repeats, 1 CDM per condition per repeat [quantified in fig. S9 (A to C.)]. GAPDH, glyceraldehyde-3-phosphate dehydrogenase. (E and F) Representative images (E) and quantification of TKCC05 pLKO.1 and Merlin-48 AIG assays (F) treated with vehicle or FAKi. n = 3 repeats, 4 replicates per treatment group per repeat. (G) Timeline for TKCC05 pLKO.1 and Merlin-48 tumors. (H and I) Quantification of TKCC05 pLKO.1 (solid) and Merlin-48 (dashed lines) tumor growth over time (H) and tumor size at day 26 (I) upon treatment with vehicle/saline (pLKO.1, n = 9; Merlin-48, n = 9), vehicle/gemcitabine/Abraxane (pLKO.1, n = 10; Merlin-48, n = 9), FAKi/saline (pLKO.1, n = 9; Merlin-48, n = 10), and FAKi/gemcitabine/Abraxane (pLKO.1, n = 8; Merlin-48, n = 10 animals). (J) Representative images of endpoint tumors. Scale bar, 1 cm. (K) Quantification of TKCC05 pLKO.1 and Merlin-48 tumor growth rate upon treatment with FAKi/gemcitabine/Abraxane. Results: means ± SEM. (L) Kaplan-Meier analysis of human PC survival correlating to low Merlin and high FAK versus others. P values were determined using unpaired two-tailed t test with Welsh correction for unequal variance (B, C, and K), one-way ANOVA with Tukey correction for multiple comparisons (F, H, and I), or log-rank test (L). Unless otherwise stated, all significance is compared to vehicle. ns, P > 0.05; *P < 0.05, **P < 0.01, and ***P < 0.001.

