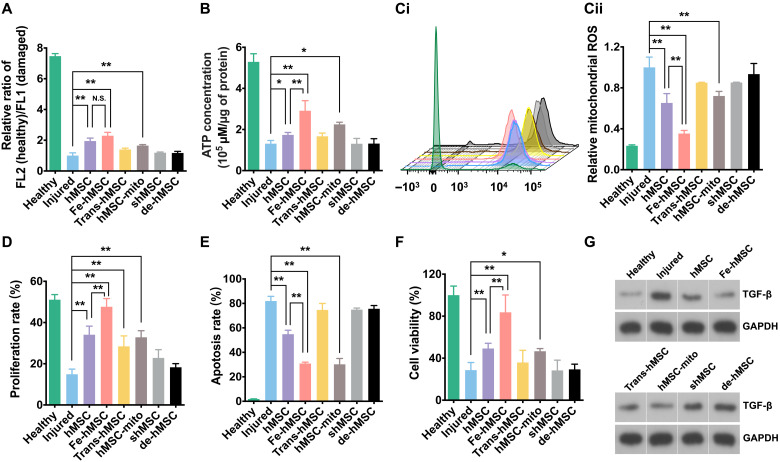
Fig. 4. IONPs improved the therapeutic ability of hMSCs to restore injured cells.
(A) Mitochondrial membrane potentials of TC-1 cells after the indicated treatments assessed by comparing the ratio of healthy mitochondria to damaged mitochondria (n = 3). (B) Intracellular ATP levels of TC-1 cells after the indicated treatments (n = 3). (C) Relative mitochondrial ROS levels of TC-1 cells after the indicated treatments. (Ci) Fluorescence intensity of ROS probe evaluated by flow cytometry. (Cii) Quantitative data of Ci (n = 3). (D) Proliferation rates of TC-1 cells after the indicated treatments evaluated by the ethynyl deoxyuridine (EdU) cell proliferation detection kit (n = 3). (E and F) Cellular apoptosis and viability of TC-1 cells after the indicated treatments (n = 3). (G) TGF-β expression levels of TC-1 cells after the indicated treatments. Data are presented as means ± SD (A to F). Statistical significance was calculated using ordinary one-way ANOVA (A to F). *P < 0.05 and **P < 0.01. N.S., no significant difference.

