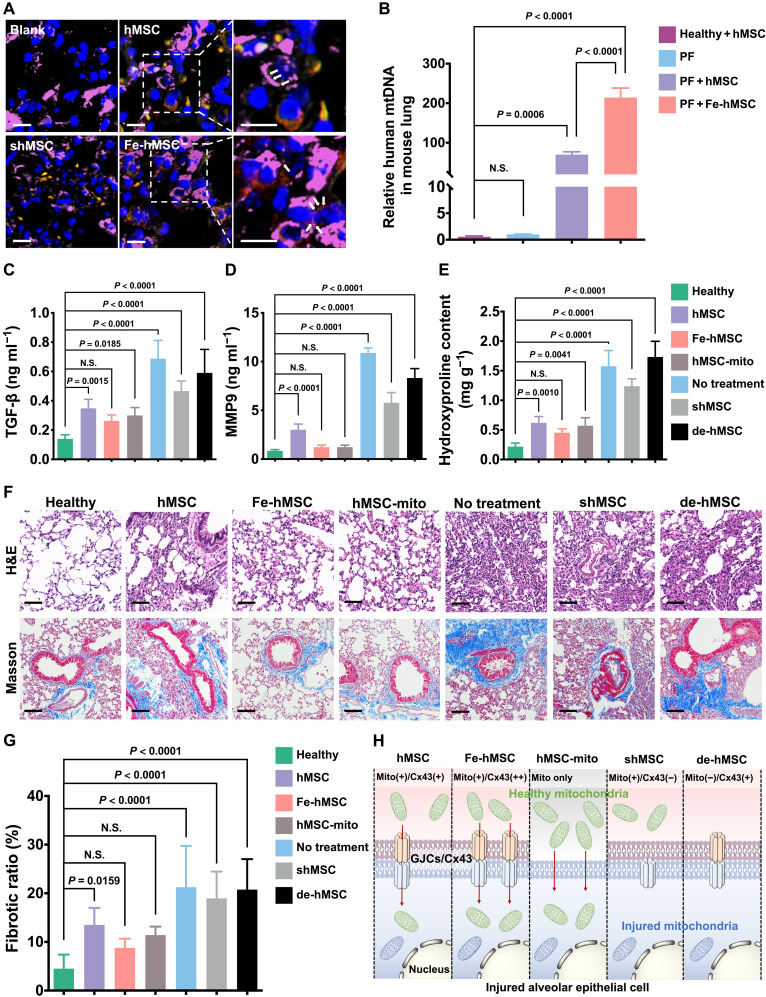
Fig. 6. The mitochondrial transfer rate determines the therapeutic efficiency against PF progression.
(A) Representative images of recipient mice pulmonary sections after immunofluorescence staining. The transferred mitochondria originating from hMSCs or Fe-hMSCs are indicated by white arrows. (Blue, nuclei; green, hMSCs, Fe-hMSCs, and shMSCs; red, mitochondria of hMSCs or Fe-hMSCs; purple, AECs). Scale bars, 10 μm (left); 5 μm (right). (B) Relative amount of human mtDNA in isolated AECs (n = 3). (C and D) Amount of TGF-β and MMP9 in collected BALF after the indicated treatments (n = 6). (E) Hydroxyproline content in lung homogenates after the indicated treatments (n = 3). (F) Representative images of H&E-stained and Masson’s trichrome–stained pulmonary sections after the indicated treatments. Scale bars, 100 μm. (G) Quantitative analysis of the fibrotic area according to the above Masson’s trichrome staining was conducted in ImageJ (n = 6). (H) Schematic figure illustrating that the efficiency of the current therapeutic strategy is closely related to the mitochondrial transfer rate through Cx43-containing GJC approach. Data are presented as means ± SD (B to E and G). Statistical significance was calculated using ordinary one-way ANOVA (B to E and G).

