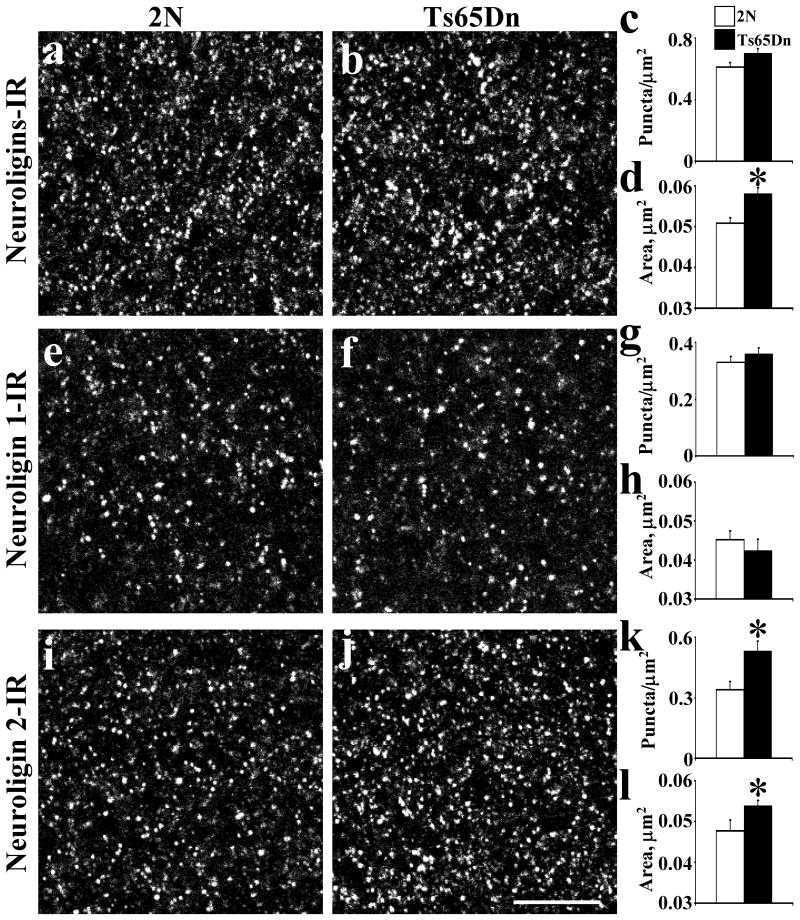
Fig. 5.
Quantitative analysis of the distribution of neuroligins-IR (a-d), neuroligin 1-IR (e-h) and neuroligin 2-IR (i-l) in the fascia dentata in 2N and Ts65Dn mice at 3 months old. The density (c, g, k) and area of individual puncta (d, h, l) with intensity value above a background threshold were calculated. Results are mean ± SEM. Number of mice examined: 2N = 6, Ts65Dn = 6. *P < 0.05, significantly different from 2N mice. Scale bar = 10 μm.

