. 2021 Aug 26;10:e70658. doi: 10.7554/eLife.70658

Figure 2. SPR analysis.

(A) Overlay of traces showing association and dissociation when WT RBD is injected for 30 s at the indicated concentration over immobilised WT ACE2. The right panel shows an expanded view of the dissociation phase. The blue lines show the fits used for determining the kon and koff. The kon was determined as described in Figure 2—figure supplement 2. The koff (B) and kon (C) values measured at different levels of immobilised ACE2 are shown. (D) The equilibrium KD was determined by plotting the binding at equilibrium against [RBD] injected. Data from experiment shown in (A). (E) The equilibrium KD measured at different levels of immobilised ACE2 are shown.

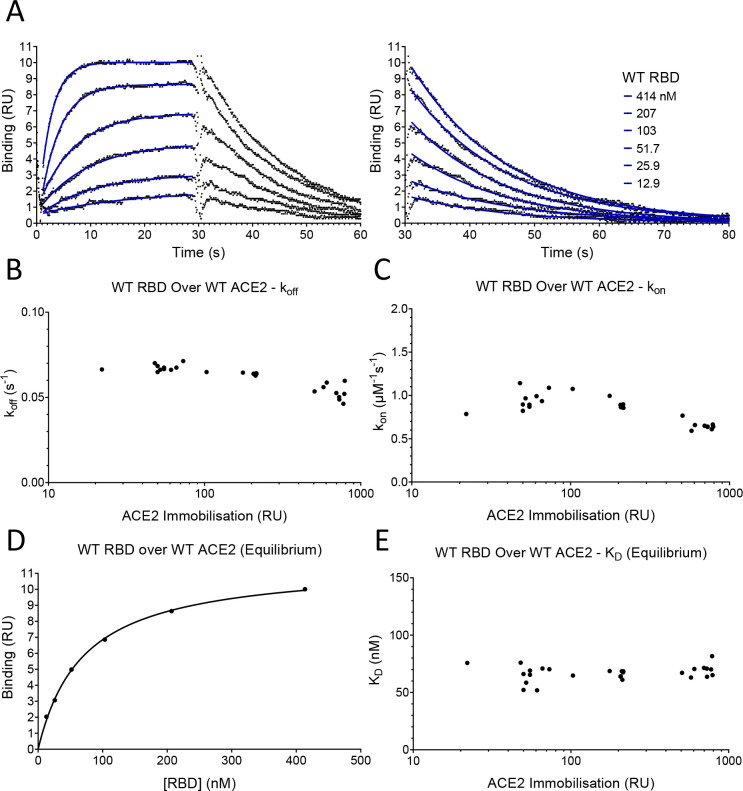
Figure 2—source data 1. Source data for Figure 2.
elife-70658-fig2-data1.xlsx (349.4KB, xlsx)

Figure 2.

Figure 2—figure supplement 1. Protein purification.

Figure 2—figure supplement 1.

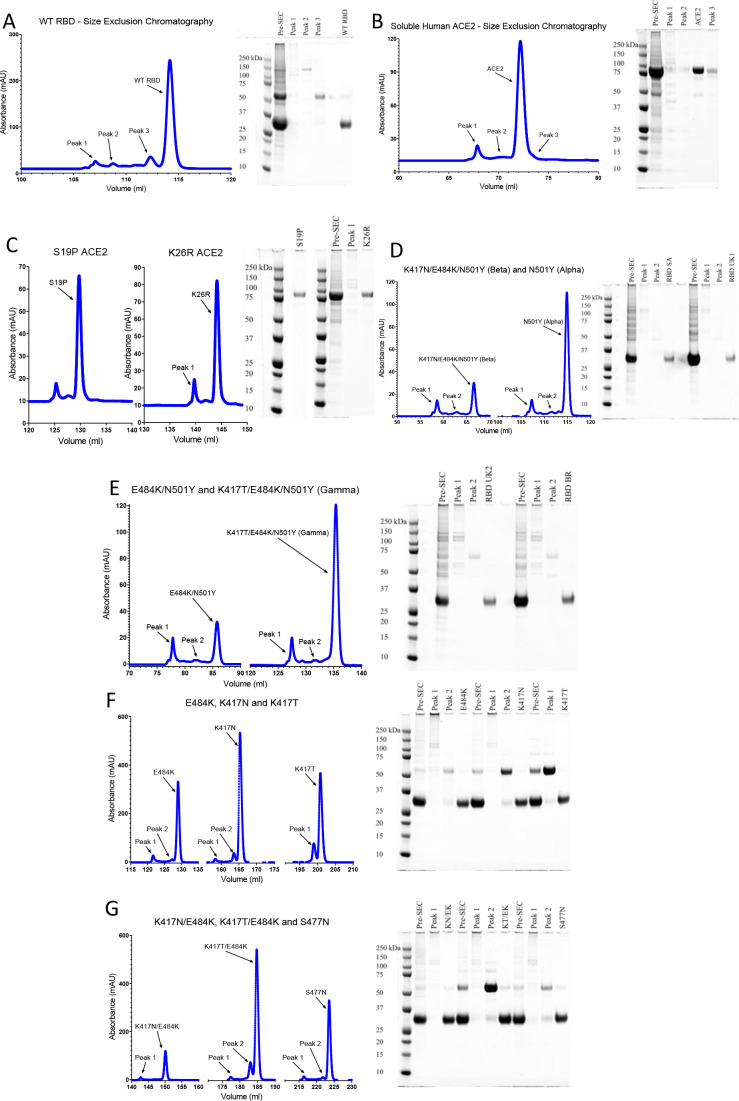
Size-exclusion chromatography traces of the indicated ACE2 and RBD proteins and reducing SDS–PAGE of the indicated peak fractions. UK2 refers to the VOC-202102–02 variants. In preparations of RBD, unidentified ~60 kDa contaminants were present at various levels, but always <5% by densitometry.
Figure 2—figure supplement 2. Determining the kon and koff.

Figure 2—figure supplement 2.

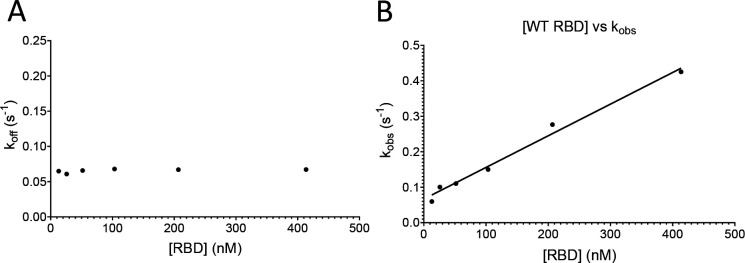
Analysis of data from the fits in Figure 2A. (A) A plot of koff obtained for each injection versus [RBD]. (B) A plot of kobs for each injection versus [RBD]. The line shows a constrained fit of the equation kobs = kon*[RBD]+ koff, using the koff obtained in (A). The kon was obtained from the slope.
Figure 2—figure supplement 2—source data 1. Source data for Figure 2—figure supplement 2.