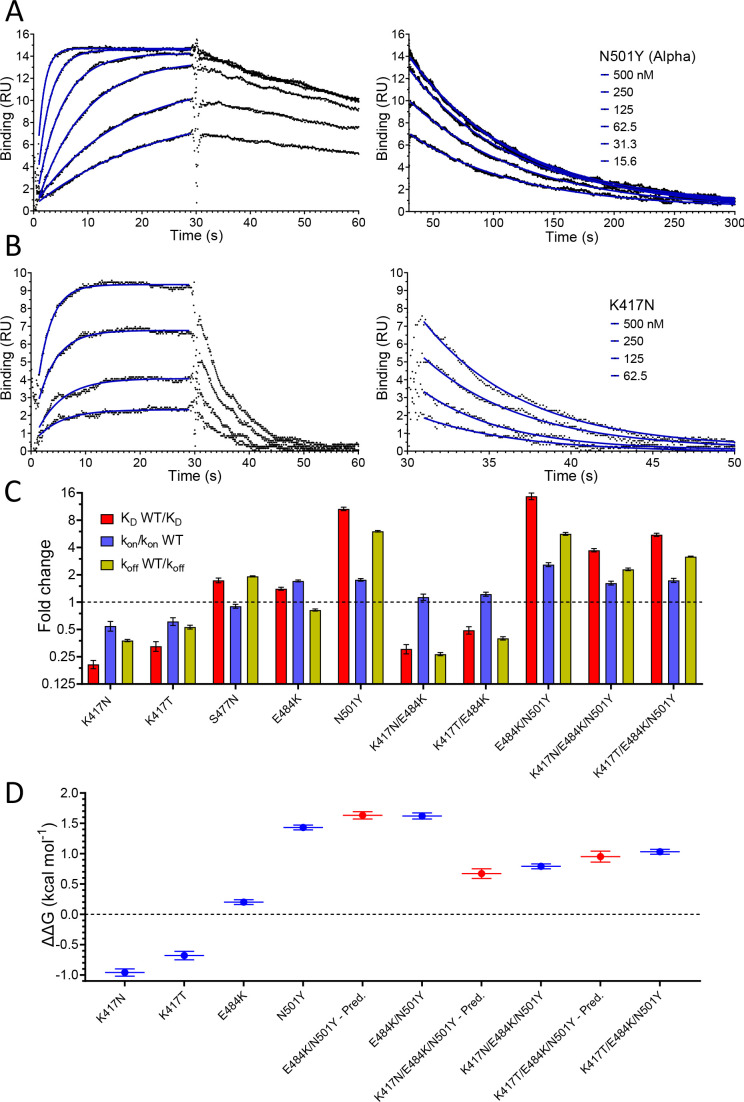
Figure 3. Effect of RBD mutations on binding to WT ACE2.
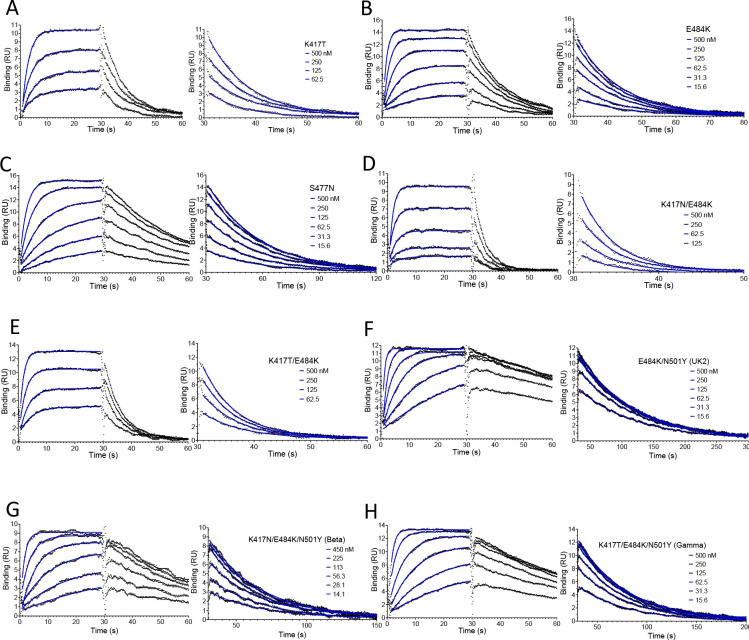
Overlay of traces showing association and dissociation of N501Y (A) and K417N (B) RBD variants when injected at a range of concentrations over immobilised WT ACE2. The right panels show an expanded view of the dissociation phase. The blue lines show fits used for determining the kon and koff. (C) The fold change relative to WT RBD of the calculated KD, kon, and koff for binding of the indicated RBD variants to immobilised WT ACE2 (error bars show SD, n = 3). Representative sensorgrams from all mutants shown in Figure 3—figure supplement 2, and the mean values from multiple repeats are in Table 1. (D) The blue lines show the measured ΔΔG for indicated RBD variants. The red lines show the predicted ΔΔG for the RBD variants with multiple mutations, which were calculated by adding ΔΔG values for single mutation variants (error bars show SD, n = 3).


