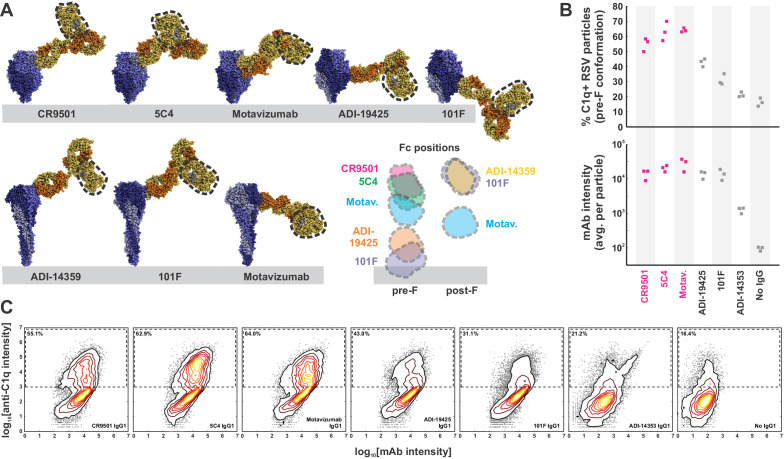
Figure 2. Complement activation and C1q binding varies with Fc position.
(A) Modeling Fc positions for F-specific mAbs. Structures for RSV F (or portions thereof) with bound antibodies (PDB IDs 6OE4, 5W23, 4ZYP, 3IXT, 6APD, 6APB, and 3O45) were aligned with human IgG1 (PDB ID 1HZH) to determine representative locations accessible to antibody Fc regions (indicated by dashed outline). Distances from the viral membrane range from ~1 nm (101F) to ~18 nm (CR9501, ADI-14359). (B) C1q binding to predominantly pre-F RSV particles opsonized with different antibodies. The top plot shows the percentage of C1q+ particles, defined as those with a total intensity of anti-C1qA antibody >103. The bottom plot shows the intensity of anti-F mAb for each condition. Individual points represent values for three biological replicates. Antibodies determined to activate complement from pre-F antigens (Figure 1) are shown in magenta. (C) Distributions of anti-F mAb intensities (horizontal axis) and anti-C1qA antibody intensities (vertical axis) for different anti-F mAbs bound to pre-F particles. Particles within the dashed rectangles indicate those that are C1q-positive, and the percentage of these particles is indicated in the upper left. Distributions are combined from the same three biological replicates represented in B. See also Figure 2—source data 1.

