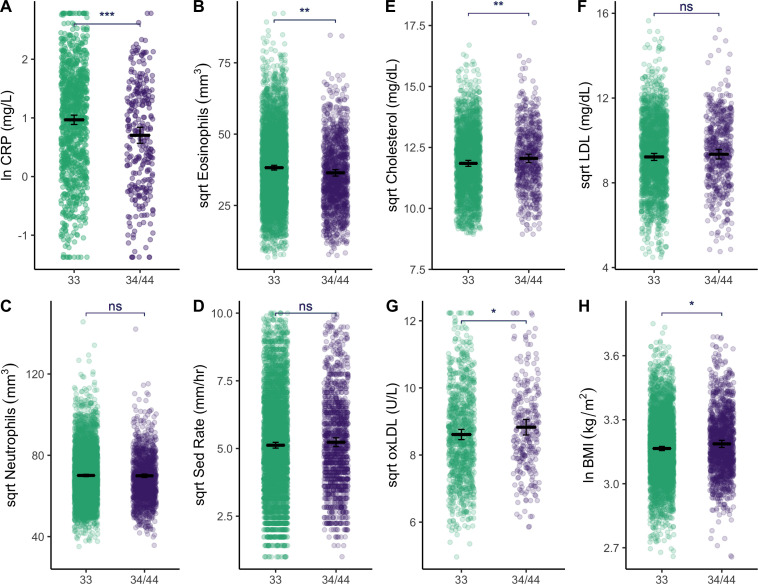
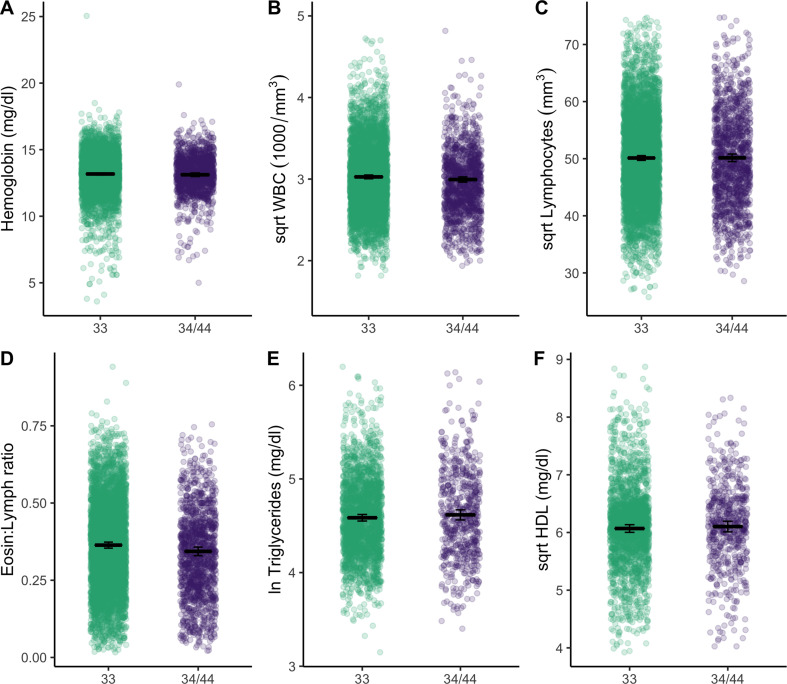
Figure 3. Plots show distributions of biomarker data (raw) grouped by APOE genotype (homozygous APOE 33 versus those that have at least one copy of the E4 allele).
All plots include estimated means (horizontal lines) and standard errors (crossbars) per genotype, derived from mixed effects linear regression models that adjust for age, sex, season, and current illness. For full models with covariates, see Supplementary file 1b, c and e. Erythrocyte sedimentation rate is abbreviated as ‘Sed Rate’. See Figure 3—figure supplement 1 for additional plots comparing of biomarkers by APOE genotype. Statistical significance is denoted as: *p ≤ 0.05; **p ≤ 0.01; ***p ≤ 0.001.


