. 2021 Aug 19;10:e71474. doi: 10.7554/eLife.71474

Figure 4. HsTMEM120A contains an internal CoASH-binding site within each monomer.

(A) Electrostatic potential surface presentation of HsTMEM120A dimer reveals a deep coenzyme A (CoASH)-binding cavity with an electropositive surface. Left, side view; right, top view along the membrane normal from the intracellular side. The CoASH molecules are presented as sphere models. (B) The cryo-electron microscopy (cryo-EM) density of the ligand molecule bound to HsTMEM120A fitted with a refined structural model of CoASH. (C) Mass spectrometry analysis of the small molecule extracted from the purified HsTMEM120A protein. The chemical models of CoASH molecule and its fragments are shown above the corresponding peaks with m/z values 768.1232, 428.0344, and 261.1280. (D) Isothermal titration calorimetry analysis on the kinetic interactions between CoASH and HsTMEM120A. The background heat of control was subtracted from the heat generated during binding of CoASH to HsTMEM120A. The result is fit with the single-site-binding isotherm model with ΔH = –31.09 ± 0.97 kcal/mol and Kd = 0.685 ± 0.045 μM. (E) Top view of the CoASH-binding site from the cytosolic side. The cryo-EM densities of CoASH and the surrounding amino acid residues (contoured at 9.5 rmsd) are superposed on the structural model. (F, G) Side views of the detailed interactions between CoASH and the adjacent amino acid residues of HsTMEM120A from two different angles. The blue dotted lines indicate the hydrogen bonds or the salt bridge between Lys130 NZ and CoASH O2B (3.6 Å), Lys130 NZ and CoASH O8A (3.4 Å), and Gln237 NE2 and CoASH N1A (3.8 Å). The purple dotted line shows the π-π interaction between Trp193 and CoASH at 4.2–4.5 Å distances. The pink dotted lines exhibit the non-polar interactions between CoASH and the adjacent residues (Arg188, Ile189, Leu279, and Val328) at <4 Å distance.

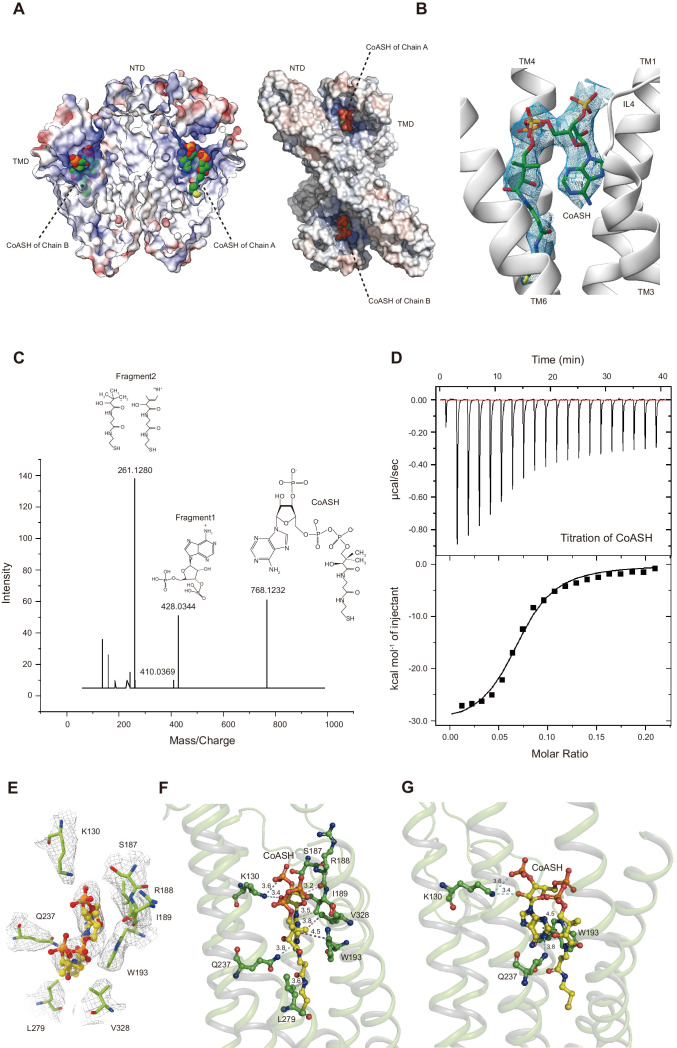
Figure 4.

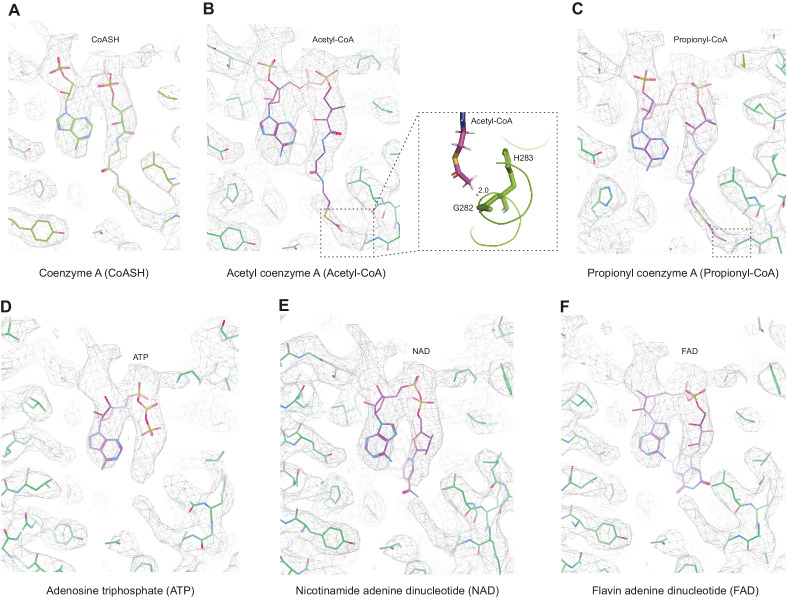
Figure 4—figure supplement 1. Fitting of the cofactor density with various small-molecule models.

Figure 4—figure supplement 1.

(A) Coenzyme A (CoASH). (B) Acetyl-CoA. The area in the dashed box indicates the local region with clashes between the acetyl group of acetyl-CoA model and Gly282-His283 region of the protein. (C) Propionyl-CoA. The local region in the dashed box at the bottom right has a clash between the propionyl group of propionyl-CoA model and the protein. For palmitoyl- or oleoyl-CoA, the fatty acyl group is too long to fit in the density. (D) Adenosine triphosphate (ATP). There is an extra density of the cofactor not covered by the ATP model. (E) Nicotinamide adenine dinucleotide (NAD). Note that the bulky nicotinamide group does not match with the cofactor density. (F) Flavin adenine dinucleotide (FAD). The bulky flavin group of FAD is not covered by the cofactor density. In (A-F), the cryo-electron microscopy (cryo-EM) map of HsTMEM120A in the nanodisc is contoured at 6.4 rmsd level.
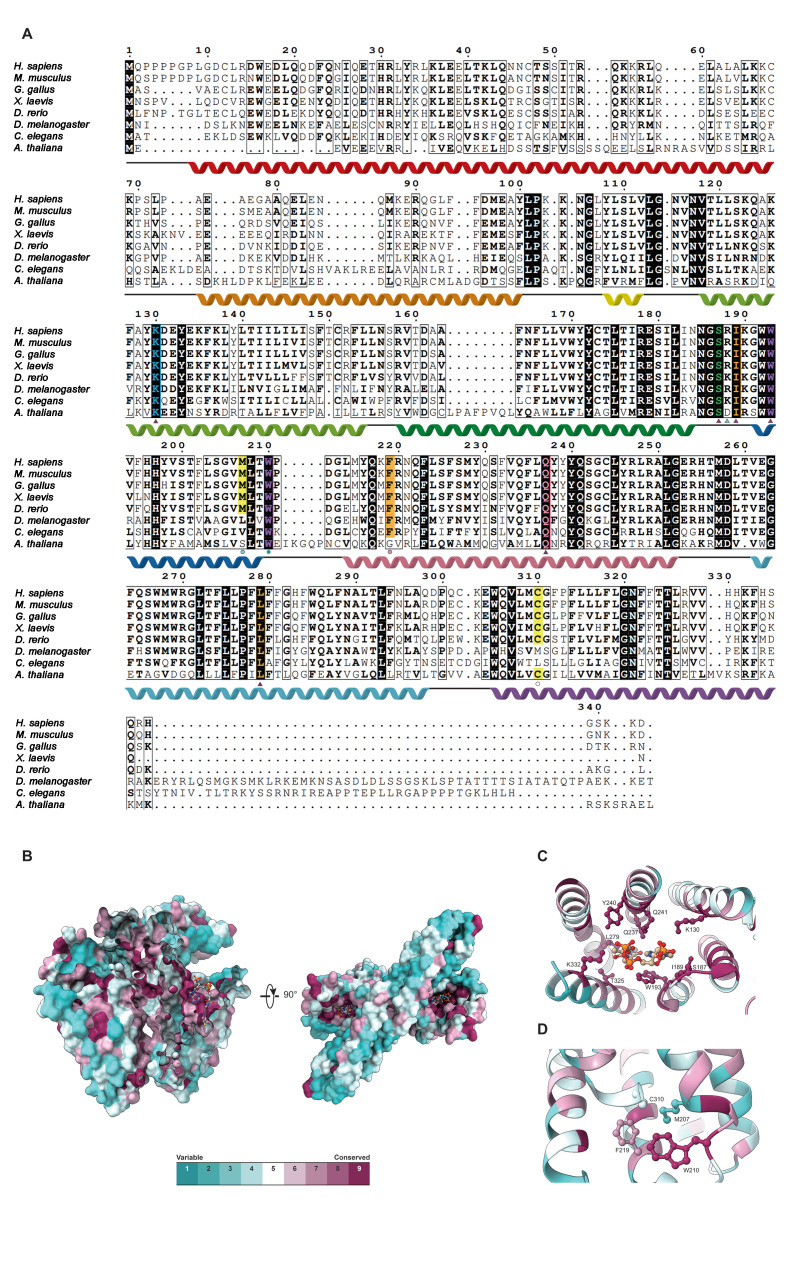
Figure 4—figure supplement 2. The conserved features of TMEM120A.

Figure 4—figure supplement 2.

(A) Sequence alignment of HsTMEM120A with other homologs from different species. The highly conserved amino acid residues are highlighted in a dark background. The triangles denote the coenzyme A (CoASH)-binding residues, and the color code is the same as the one for ConSurf conservation score bar shown in (B). The circles indicate the amino acid residues located in the narrowest region of channel pore. The α-helices and associated loops are indicated by the helical ribbons and dark lines labeled above the sequences, respectively. Accession codes: Homo sapiens (NP_114131.1), Mus musculus (NP_766129.1), Gallus gallus (XP_040543083.1), Xenopus laevis (NP_001091170.1), Danio rerio (NP_001076452.1), Drosophila melanogaster (NP_001245509.1), Caenorhabditis elegans (NP_001370801.1), and Arabidopsis thaliana (CAD5314357.1). (B) Mapping of the conserved amino acid residues on the surface of HsTMEM120A structure. The conserved residues are shown in dark pink, while the variable ones are in cyan. (C, D) The amino acid residues located at the CoASH-binding site and the constriction area, respectively.
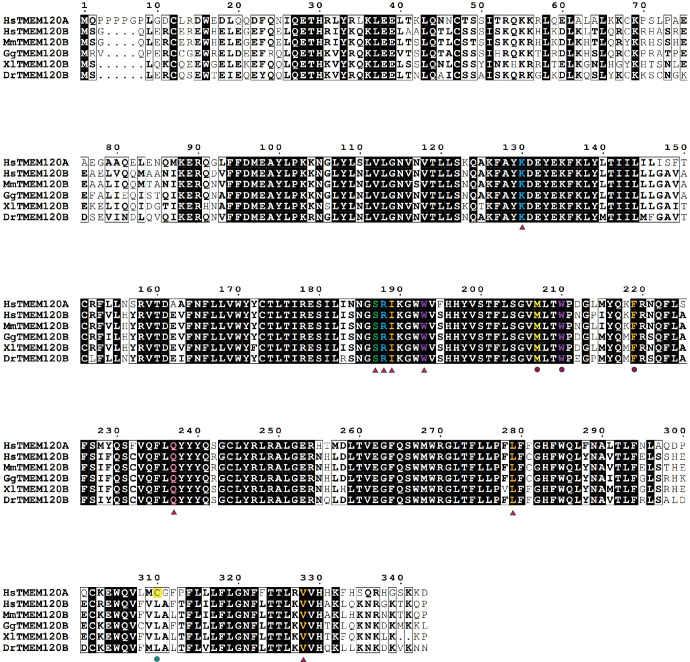
Figure 4—figure supplement 3. Sequence alignment of HsTMEM120A with various TMEM120B orthologs.

Figure 4—figure supplement 3.

Hs, Homo sapiens (NP_001074294.2); Mm, Mus musculus (NP_001034812.1); Gg, Gallus gallus (NP_001376307.1); Xl, Xenopus laevis (NP_001086700.1); Dr, Danio rerio (XP_005169279.1).
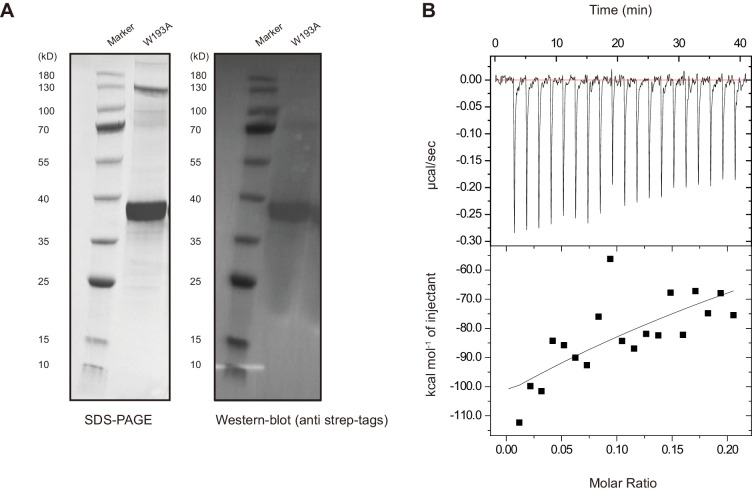
Figure 4—figure supplement 4. Analysis of CoASH-binding property of the W193A mutant of HsTMEM120A.

Figure 4—figure supplement 4.

(A) Sodium dodecyl sulfate-polyacrylamide gel electrophoresis (SDS-PAGE) and western blot analyses of the purified W193A protein. (B) Isothermal titration calorimetry (ITC) analysis of W193A protein sample titrated with coenzyme A (CoASH). The data were fit with the single-site-binding isotherm model with Kd = 198.41 ± 0.81 μM.
Figure 4—figure supplement 4—source data 1. Source files for the ITC data, gel image, and western blot (Figure 4—figure supplement 4A,B).