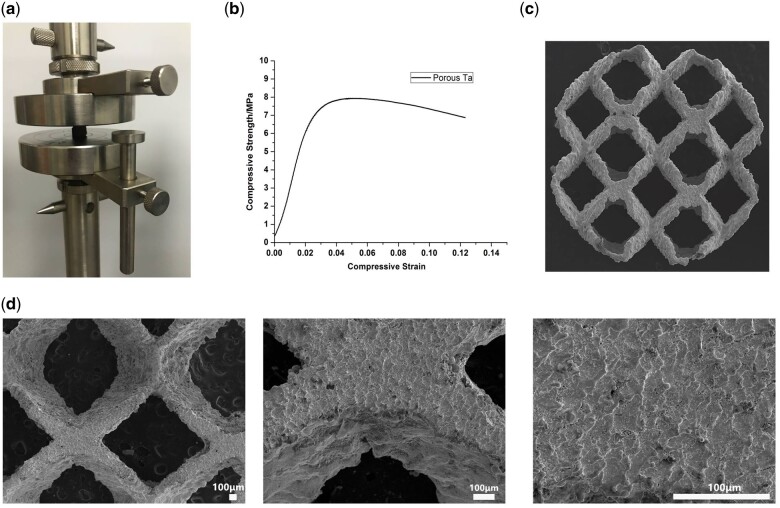
Figure 3.
Mechanical properties and surface morphologies of pTa. (a) Compression experiment. (b) Stress–strain curve. (c) Surface morphologies of pTa. (d) Flat morphology and the metallic luster of dark gray were shown. These images were magnified ×30, ×100, and ×200, respectively (scale bar = 100μm).

