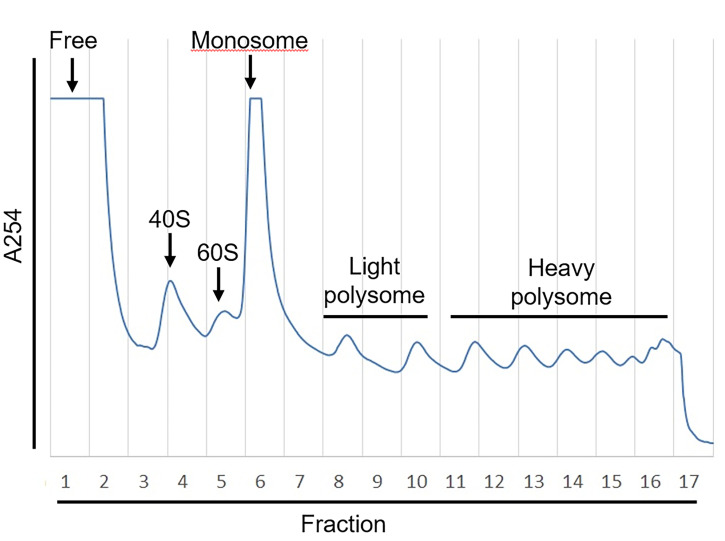
Figure 3. Example of Polysome Profiling.
The absorbance of OD254 (A254) that represents the abundance of RNA fragments was measured by UA-6 detector. The sucrose gradient was fractionated into 17 fractions with Density gradient fractionation system. The value of A254 was recorded by Peak Chart and plotted as shown.

