
Figure 10.
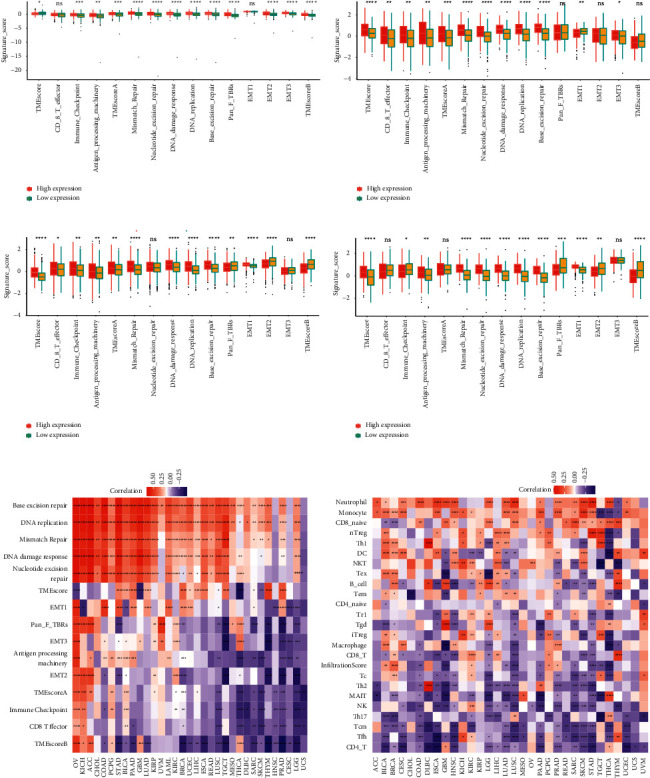
Correlation analysis between BOP1 and tumor microenvironment: (a) OV, (b) BLCA, (c) BRCA, and (d) STAD. (e) Correlation between BOP1 expression and TME-related biological processes in 33 tumors. (f) Correlation between BOP1 expression and immune cell infiltration. ∗P < 0.05, ∗∗P < 0.01, and ∗∗∗P < 0.001.