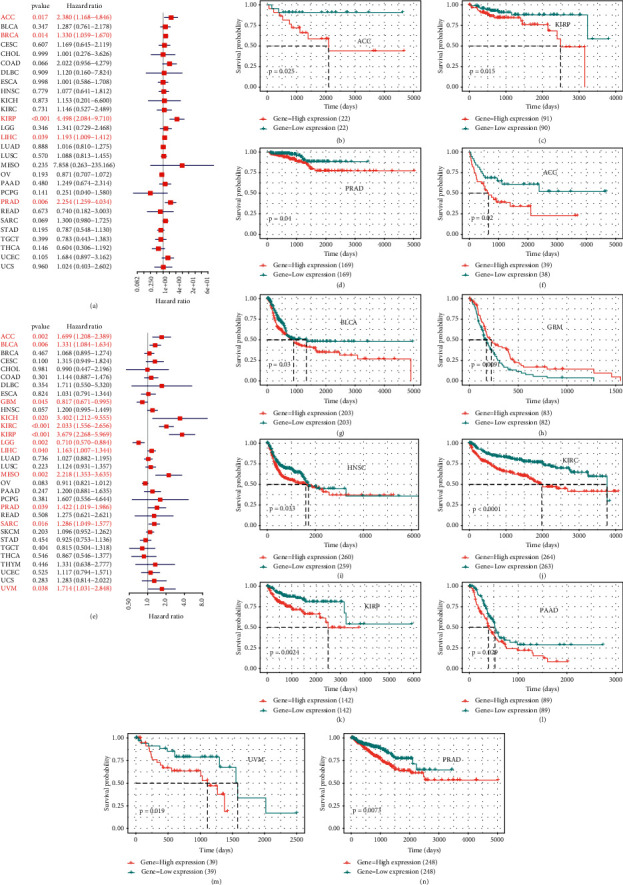
Figure 5.

The correlation of BOP1 expression and DFI and PFI in 33 cancers. (a) Forest plot of DFI in 33 tumors. (b–d) Kaplan–Meier curves of DFI for BOP1 expression. (e) Forest plot of PFI in 33 tumors. (f–n) Kaplan–Meier curves of PFI for BOP1 expression.
