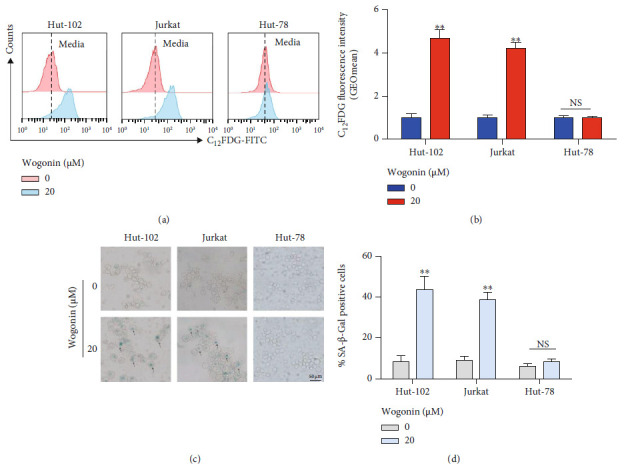
Figure 2.

Wogonin induced cellular senescence in Hut-102 and Jurkat cells but not Hut-78 cells. (a) Cells (Hut-102, Jurkat, and Hut-78 cells) were treated with or without 20 μM wogonin for 5 d. SA-β-Gal activity was measured by C12FDG fluorogenic substrate of SA-β-galactosidase using flow cytometry. Representative peak graphs from one of the three independent experiments, illustrating C12FDG fluorescence. (b) Quantification of SA-β-Gal activity measured by C12FDG fluorescence. The dark blue histogram represents control cells, and the red histogram represents cells that were cultured in the presence of 20 μM wogonin. Columns represent the mean from three parallel experiments (mean ± SEM). ∗p < 0.05, ∗∗p < 0.01, compared with the control group. (c) SA-β-Gal activity was measured by SA-β-Gal staining in cells (Hut-102, Jurkat, and Hut-78 cells) treated with or without 20 μM wogonin for 5 d. Representative images from one of the three independent experiments. Representative pictures are shown (magnification, ×200). (d) Quantification of SA-β-Gal activity measured by cell staining. The grey histogram represents control cells, and the blue histogram represents cells that were cultured in the presence of 20 μM wogonin. Columns represent the mean from three parallel experiments (mean ± SEM). ∗p < 0.05, ∗∗p < 0.01, compared with the control group.
